70 Orthognathic Surgery
Introduction
The secret to facial beauty is balanced proportion of facial features. The overall attractiveness of the face is a composite of all of the anatomical elements, including skin, subcutaneous tissues, muscle, bone, and teeth. Facial plastic surgeons concern themselves daily with the achievement of this harmonious balance.
To achieve or approach an aesthetic ideal, the facial plastic surgeon must have a clear concept of proportion, a method to analyze deformities, and the ability to apply specific techniques to deformities. Although surgery of the nose involves correction of skeletal abnormalities, aesthetic surgery on the remainder of the face is mainly concerned with soft tissue deformities. In many instances, surgery of the soft tissues is sufficient; however, attention must often be paid to underlying skeletal deformities to correct many congenital and traumatic reconstructive problems.
Evaluation of facial deformities should include skeletal and soft tissue analysis. Soft tissue analysis can be done in an unstructured way through focused observation. It can also be achieved by careful study of consistent frontal and lateral photographs. Skeletal analysis involves evaluation of the facial bones and teeth. Generally, hard tissue analysis is easier to quantify. It is achieved by determining the patient’s dental occlusion and through the use of cephalometric radiography.
After careful skeletal and soft tissue analysis, a detailed, systematic treatment plan is established. This involves using dental and bony models and is often the product of input from multiple specialty fields. Surgical correction of the specific dentofacial deformities is then performed and, it is hoped, facial harmony is established.
Aesthetic Facial Analysis
Dental Analysis
The establishment of balanced facial proportions begins with good dental occlusion. Occlusion is the relationship of the maxillary to the mandibular teeth. This relationship largely depends on the relative position and angulation of the teeth to each other. Malocclusion refers to a dental relationship that is less than optimal. It can result from dental or skeletal deformities or a combination of both.
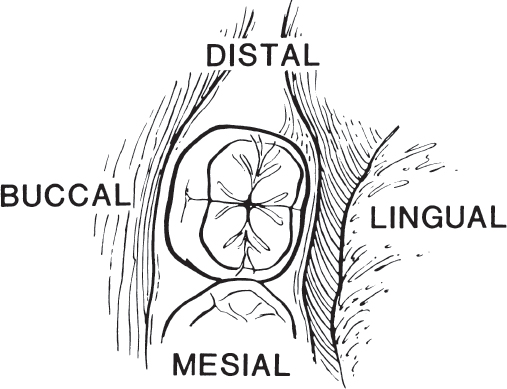
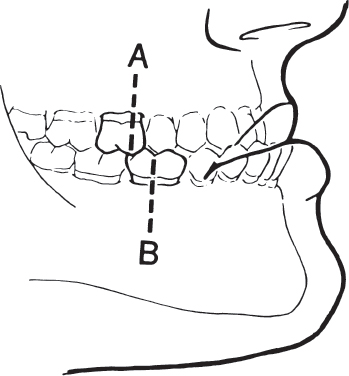
In 1899, Angle developed a classification system to describe normal and abnormal dental occlusion. 1 The reference point in the Angle classification is the relationship of the maxillary to the mandibular first molar teeth. Each molar tooth has four grinding surfaces, called cusps. The surfaces adjacent to each cusp are referred to as grooves. Cusps adjacent to the tongue are called lingual and those adjacent to the cheek are called buccal. Cusps located anteriorly, or toward the midline, are referred to as mesial, and those situated posteriorly or away from the midline are called distal ( Fig. 70.1 ).
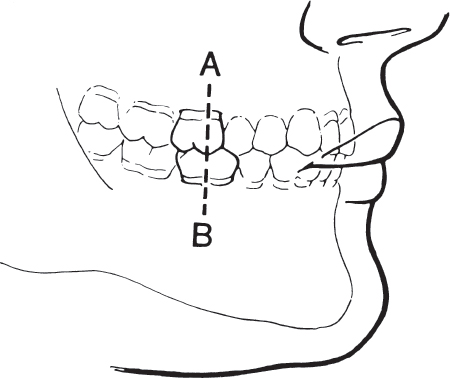
There are three general categories of occlusion in the Angle classification system. In class I occlusion, the mesial buccal cusp of the first maxillary molar fits in the groove on the lateral or buccal surface of the first mandibular molar tooth ( Fig. 70.2 ). However, this only represents the ideal relationship of the molar teeth. When the remainder of the teeth interdigitate perfectly, the occlusal relationship is said to be normal. Malocclusion can exist when the molar relationship is class I. This type of malocclusion is generally less severe and usually based on dental rather than skeletal deformities. Although the molar relationship is normal, crowding of the anterior teeth may occur. Another variation of class I malocclusion occurs when there is bimaxillary protrusion. In this situation, the mandibular length is excessive, causing a protrusion of both upper and lower incisor regions.
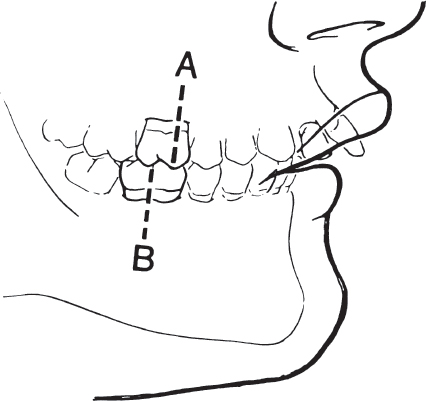
Class II malocclusion is skeletally and dentally based. The mesial buccal cusp of the first maxillary molar is mesial, or in front of the first mandibular molar ( Fig. 70.3 ).
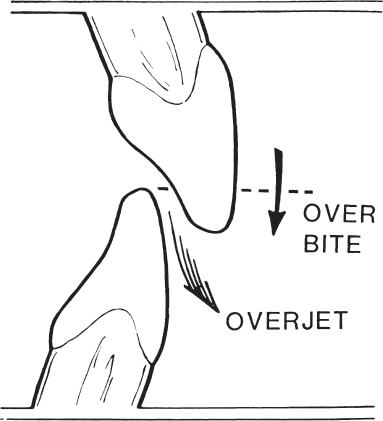
There are two subtypes of class II occlusion. In the more common subtype, division 1, there is excessive overjet (anterior maxillary protrusion), and the maxillary incisors are quite protrusive. In division 2, there is a deep bite (overbite) with the maxillary incisors overlapping and covering the mandibular front teeth by more than the usual amount. There is a posterior tilting of the central incisors and a flaring of the lateral incisors. A deep bite is present, but overjet is not as pronounced ( Fig. 70.4 ).
Class II malocclusion may arise from a lack of mandibular development. The resulting posteriorly positioned mandible is termed retrognathia. This condition often prevents the upper lip from completely covering the upper incisor teeth. Lack of complete lip seal exposes the upper incisors, rendering them more vulnerable to injury. A class II molar relationship may also arise from an abnormally protuberant maxilla.
The class III malocclusion is primarily skeletally based. It is characterized by a large protrusive mandible or an underdeveloped, retrusive maxilla. The mesial buccal cusp of the first maxillary molar is positioned distal to its ideal position ( Fig. 70.5 ). Protrusion of the mandible is called prognathism.
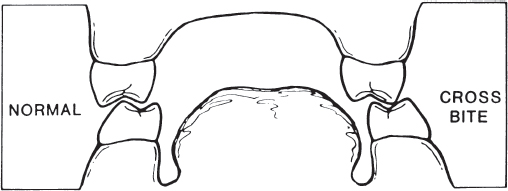
In addition to anteroposterior malocclusions, suboptimal relationships can exist in a medial to lateral direction ( Fig. 70.6 ). The ideal relationship occurs when the buccal cusps of the maxillary molar teeth are just lateral to the opposing mandibular buccal cusps. If the maxillary and mandibular molar cusps contact endto-end or the maxillary buccal cusps are medial to their mandibular counterparts, a lingual cross-bite is present. If the maxillary teeth are more lateral than is ideal, a buccal cross-bite exists.
Malocclusion can thus result from dental or skeletal abnormalities or a combination of both. The cause of malocclusion may be congenital, traumatic, or a consequence of extirpative surgery for neoplastic disease. The dentofacial deformities produced may cause both cosmetic and functional problems. These include difficulties with speech, mastication, and swallowing. It is therefore imperative that the facial plastic surgeon carefully address the occlusal relationships when treating any facial deformity. 2
Skeletal Analysis
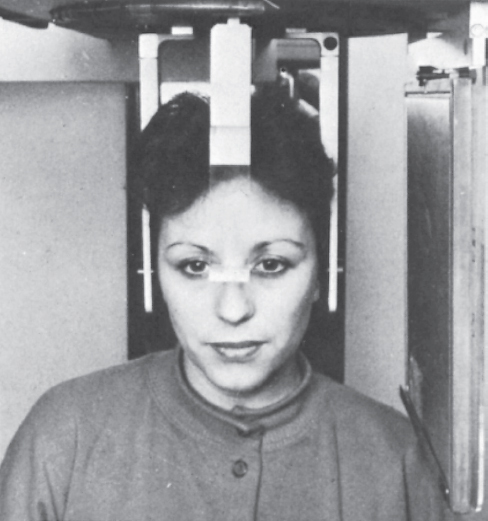
The assessment of craniofacial dimensions is important in diagnosing structural facial dysharmony. Attempts have been made for years by artists, surgeons, and orthodontists to analyze and quantify the proportions of the face. Cephalometry, the scientific measurement of the dimensions of the head, was first used in orthodontics to assess craniofacial growth. Another method for craniofacial analysis based on cephalometry is cephalometric radiography. Although cephalometric radiography was originally introduced into orthodontics during the 1930s, widespread acceptance of the method has only occurred during the past 20 years. 3 In 1931, Hofrath and Broadbent simultaneously and independently developed methods for the production of standardized cephalometric radiographs. 4 This standardization is achieved using a specialized device, known as a cephalostat, which holds the head in a fixed and reproducible position ( Fig. 70.7 ). 5 The cephalostat stabilizes the head with three rods. One rod fits in each external auditory meatus, and a third rod rests passively on the inferior orbital rim or the nasofrontal suture. The radiograph taken is a true lateral view, with no head rotation in the sagittal plane. The cephalometric film should be taken with soft tissue technique to most clearly demonstrate the relationship between the soft tissues and the facial skeleton. 6 To further standardize the radiograph and to minimize distortion, a consistent subject-to-film distance and X-ray target-to-subject distance must be used.
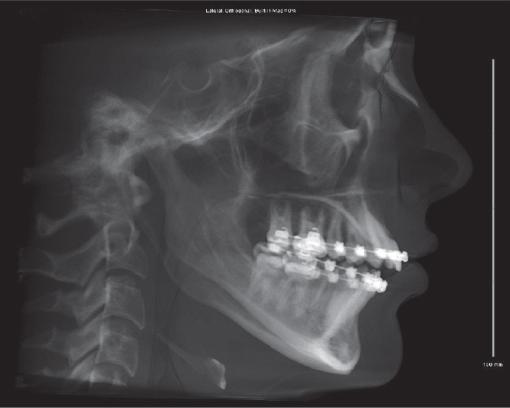
The cephalometric radiograph obtained provides a twodimensional outline of the lateral aspect of the craniofacial skeleton ( Fig. 70.8 ). It can be traced onto a matte acetate sheet to provide a model on which various analyses may be performed. However, this radiograph is subject to image distortion. The acetate model is also subject to tracing error. The purpose of the cephalometric tracing is to provide objective data that assist in the diagnosis and treatment of facial skeletal deformities.
The cephalometric radiograph allows objective evaluation of bony and soft tissue morphology. To effectively use the lateral cephalometric tracing, standardized bony landmark points must be defined. 7 These skeletal landmarks may then be used to derive reference lines and angles ( Tables 70.1–70.3 ).
Linear measurements may be obtained between any two points, and angular measurements are made between three reference points. Various linear and angular analyses are then performed to aid in the diagnosis and treatment of dentoskeletal deformities.
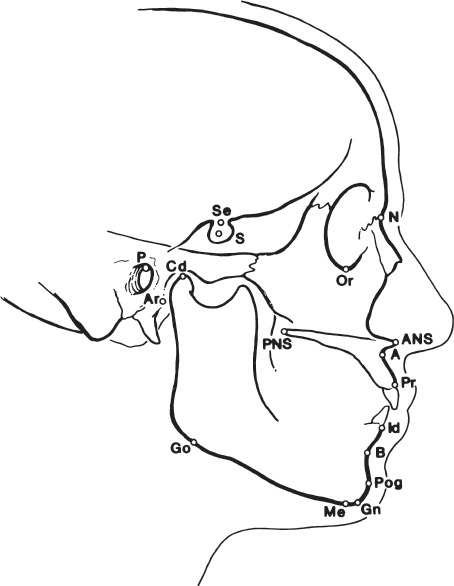
Effective evaluation of the cephalogram depends on accurate definition and localization of bony landmarks. These points may be anatomical or anthropological, and are located on or in the skeletal structures. In contrast, radiologic or constructed reference points are secondary landmarks marking the intersections of X-ray shadows or lines. The points may be unilateral (in the sagittal plane) or bilateral. Bilateral points may be difficult to precisely determine and measure and therefore may result in slight loss of accuracy. The more commonly used skeletal reference points in cephalometric analysis are seen in Table 70.2 and Fig. 70.9 .
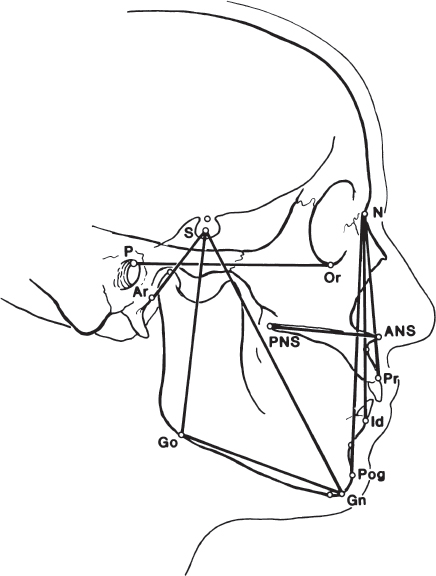
These reference points can be used to construct numerous reference lines, as described in Table 70.1 ( Fig. 70.10 ). Different lines are used for different linear analyses, with one particular line representing the reference plane on which the whole analysis is based. The Frankfort horizontal plane is based on a line joining the superior border of the bony external auditory canal with the inferior border of the infraorbital rim. The Frankfort plane is used as a reference when orienting medical photographs of patients. This plane should be oriented parallel to the floor with the patient in the upright position. However, the Frankfort plane is not usually used for cephalometric analysis because it is based on points that are not midline. As such, they are subject to error. The line connecting the nasion (N) and sella (S) is midline, and it is often used as the reference plane on which most cephalometric analysis is based.
Identification of standardized bony reference points and tines allows linear and angular measurements to be determined. These measurements can be compared with normative reference values. Deviation from these norms allows quantitation of the skeletal abnormality.
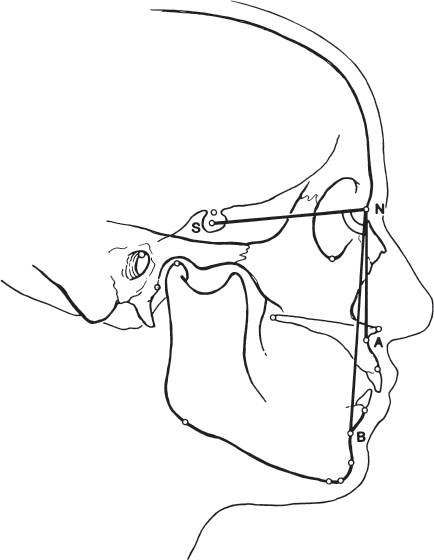
Angles SNA, SNB, and ANB are relatively simple to determine and provide valuable basic information in analyzing the relationship of the maxilla and mandible. These angles have a narrow range of normal values 3 , 8 ( Fig. 70.11 ). If the angle ANB is greater than 4 degrees, a skeletal class II malocclusion is present. The maxillary versus mandibular contribution to this malocclusion may be determined by measuring the angles SNA and SNB. If ANB is greater than 4 degrees and SNA is greater than normal, the class II malocclusion is most likely secondary to maxillary protrusion. If ANB is greater than 4 degrees and SNA is less than normal, mandibular retrognathia probably exists.
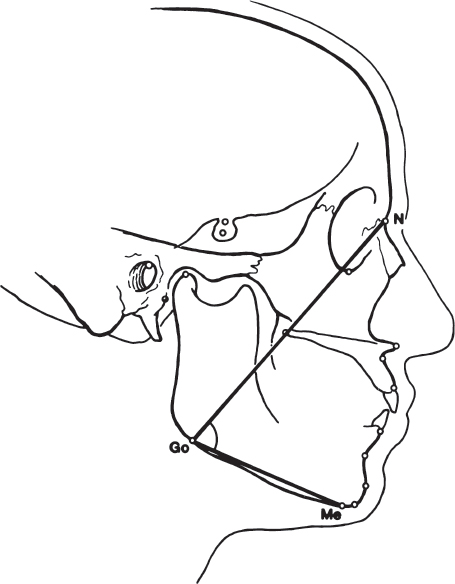
Other important angles exist ( Table 70.4 ). The Frankfort mandibular plane angle is created by the intersection of the Frankfort horizontal plane and the mandibular plane (from gonion to menton). It is defined by Tweed 9 as 20 to 29 degrees and by Burston 10 as 23 degrees. It reflects the inclination of the mandibular plane. The saddle angle is the angle between the anterior and posterior cranial bases. The articular angle (S–Ar–Go) can be affected by orthodontic treatment. It is reduced in all cases of mandibular prognathism. The gonial angle (Ar–Go–Me) plays a role in growth prognosis of the mandible and is affected by the relationship between the body and the ramus. It indicates the direction of mandibular growth, with a large gonial angle indicating posterior condylar growth. The gonial angle may be divided into upper and lower ( Fig. 70.12 ) gonial angles. 11
Various linear distances have also been described ( Table 70.5 ). Again, these lines are measured by identifying the two connecting points on the cephalometric radiograph. The mandibular base is determined by measuring the distance between the gonion (Go) and pogonion (Pog) when projected onto the mandibular plane. The maxillary base is measured from the posterior nasal spine (PNS) to point A. The distance from the sella (S) to the nasion (N) is the anteroposterior extent of the anterior cranial base.
A variety of analyses using the previously mentioned skeletal points, lines, and angles have been described. These include the Zimmer aesthetic plane, 12 the Holdaway ratio, 13 the Gonzales-Ulloa zero meridian line, 14 , 15 and others. 16 In all instances, these analyses represent an attempt to describe the normal relationship of the facial skeleton.
Related posts:

Stay updated, free articles. Join our Telegram channel

Full access? Get Clinical Tree


