Chapter 4 Prevention of burn injuries
 Access the complete reference list online at http://www.expertconsult.com
Introduction
Burns are still referred to as accidents by many in the medical community and by society in general. Believing that burns and other traumatic injuries are ‘accidents’ (‘accident-prone’ individual) implies the individual has little or no fault in the cause of injury. The word ‘accident’ means an event that takes place without one’s foresight or proceeds from an unknown cause, an unfortunate occurrence, or mishap, especially one resulting in an injury.1 Synonyms include misadventure, mischance, misfortune, mishap, and disaster. The word ‘injury’ is a more appropriate term.
Historical perspective
In Great Britain in the first decade of the 20th century the medical community was well aware that burn injuries and deaths represented a serious public health issue.2 Scalds and burns were noted to occur predominantly in children. Unguarded fires and the flammability of flannelette, a cotton fabric, were recognized as common causes of burns in children and old women. Legislation was enacted making parents liable to a fine if a child younger than 8 years was injured or died as a result of an unguarded open fire. In a review of over 3600 patients with flame burns and scalds, two-thirds of cases occurred in and around the home, one-third were at work, 50% were children, 82% were the result of clothing fires, cottons were the common fabrics, and the number of scalds about equalled that from burns, but the former were more likely to survive.3 Approximately 50% of ‘accidents’ were judged to be preventable. Research was conducted on the design and flammability of clothing. Fabrics were treated with tin, antimony, and titanium to make them relatively flame-retardant. Statistics on common locations and causes for accidents identified the kitchen and cooking, scald burns from children pulling over containers with hot liquids, and the use of flammable liquids. Burns as a result of a seizure were recognized. Prevention efforts included education and ‘propaganda’ (film, radio, newspapers, exhibits, and posters), better design of housing and improving living conditions (decreasing overcrowding), safer methods of heating houses (central heating and electric fires), use of non-flammable materials in girls’ and women’s clothing, and safer fireguard designs for coal fires. Better design of teapots, cups, and cooking utensils rendered them more difficult to tilt over. One author in 1946 expressed quite clearly that carelessness, neglect of normal precautions, and stupidity were human factors associated with burns.4 It was recognized that accurate and comprehensive burn data were lacking, but necessary if long-term prevention policies were to be enacted.
Injury control
The five key areas in injury control are:
Burn injury magnitude
The first step in any prevention program is to identify the how, who, where, and when of the injury. With this information strategic planning and implementation can be directed at reducing the risk of injury or death. In 2007 the leading causes of injury deaths, in order of magnitude, were motor vehicle collisions, drowning, firearms, falls, and finally flame/fire.6 In 1999 the number of fire deaths and injuries was 3570. In 2002 there were 3363 deaths, a decrease of less than 5.7%. The number of fire deaths increased progressively with age and peaked at 720 in those over 75. The number of non-fatal injuries (almost 79 000) was greatest between ages 35 and 44. Males were 1.6 times more likely to die in a fire. In 2008 the numbers of deaths and injuries were 3320 and 167 015, respectively.7 On average in the United States in 2008 fire departments responded to a fire every 22 seconds. One structure fire was reported every 61 seconds, and every 31 minutes one civilian fire injury was reported. One civilian fire death occurred every 2 hours and 38 minutes. Between 2003 and 2007 the US Fire Administrations’ national fire incidence reporting system identified the leading causes of home structure fires as cooking, heating equipment, intentional, electrical, and smoking. Smoking was the leading cause of home fire deaths (25%), and heating equipment ranked second (22%). Heating equipment such as portable and fixed space heaters and wood-burning stoves resulted in more fires than central heating. Candles accounted for 10%. From 1990 to 2001 this figure nearly tripled. One-third of fatal candle fires occurred when they were used for lighting when an electrical power outage occurred (hurricanes, tornados, etc.). Children under 5 were nearly eight times more likely than all other age groups to die in fires caused by playing with the heat source. Of fire injuries in homes, 43% were associated with fighting the fire, or attempting rescue; attempting escape (23%); while asleep (13%); and inability to act or acting irrationally 6%.8 For comparison, from 1980 to 2007 the death rate for children under 5 declined from 18% to 9% and for adults 65 and over increased from 19% to 29%. Nearly 50% of all cooking fire injuries occurred when the victims tried to fight the fire. Home fabric fires caused by smoking commonly originated in upholstered furniture, mattresses, or bedding. Older adults (defined as over 64 years) are at greatest risk of sustaining both fire injuries and death. The elderly are approximately 1.5 times more likely to suffer fire-related death than the general population. Those aged 85 and older are 4.5 times more likely to die in a fire than the general population. Smoking in the presence of home oxygen is frequently encountered in the elderly. Physical and mental disabilities often either contribute to the cause of the fire or hamper the escape. Populations in the lowest income levels had a greater risk of dying in a fire than those in higher income levels. The leading causes of fatal fires in residential property were incendiary/suspicious (27%), smoking (18%), and open flames (16%). The leading areas of fire origin in fatal residential structure fires were sleeping areas (29%), lounge (21%), and kitchen (15%). Fatal fires were more common in the winter, and the time of day when most structure fires occurred was between 10 am and 8 pm.
It is well recognized that many burn patients treated in emergency departments are never admitted to hospital. In 2006 the National Hospital Ambulatory Medical Survey identified 501 victims of fire, flame, or hot substances per 100 000 emergency room visits. This had changed little since 2003 (516/100 000).9
Risk factors
A number of factors must be considered when determining the fire risk to the host. Age, location, demographics, and low economic status represent important factors. The US Fire Administration (USFA) expresses much of its fire data as relative risk (RR).10 The RR of a group (example death) is calculated by comparing its rate to the rate of the overall population. An RR of 1 is given to the general population. As a general rule, many statisticians consider an RR of 4 or more as important, and an RR of 4 or more is used to identify high-risk burn populations. The RR of fire deaths in 2001 for all ages, with the exception of 0–4 years and 55 or over, was less than 1. Based on 2006 data, prevention programs should be directed at everyone over 85 years (RR 3.78), American-Indian males (RR 5.3) and African-Americans (RR 6.9). The use of RR in injury prevention is useful when resources are limited.
In 2004 children aged 0–15 years accounted for 560 fire deaths and 2007 fire injuries: 50% and 43% of deaths and injuries occurred in children less than 5 years of age. The RR of fire death for children less than 5 years was 0.74, 0.6 for ages 5–9, and 0.3 for 10–14 years. The RR of home fire injuries in children under 5 in the US between 2003 and 2007 was 1.4. For comparison, in those over 65 the RR of death was 2.3.11 The activities of children at the time of a fire injury were: sleeping (55%), trying to escape (26%), and unable to act, which implies not understanding what was happening or how to take action (9%).
Analysis of fatal pediatric fire fatalities in Philadelphia (1989–2000) revealed four significant independent variables: age under 15 years, age of housing, low income, and single parent households.12 The greatest risk was between 12:00 am and 6:00 am. The common causes were playing with matches, cigarettes or careless smoking, and incendiary. The common locations were bedroom and living room. Upholstered furniture, cooking materials, bedding, mattresses, clothing, and curtains were primary materials first ignited in fatal fires. Playing with cigarette lighters and candles, or near stoves with hot liquids, were frequent scenarios in fatal pediatric burns. The authors stressed that identifying risk factors by analyzing population characteristics by census tract was important for burn prevention. These risks are still common 11 years later.
By 2020 it is estimated that people aged 65 years and older will number approximately 55 million, an increase of 16% from 2000. By 2050 they will represent 21% of the population. In 2006 fire injuries in those over 64 accounted for 11.8% of all ages, and the RR of fire deaths between 65 and 85+ increased from 1.44 to 3.78.13 The leading causes of both death and injury from fire were smoking, cooking over an open flame, and heating equipment. Additional risks included medical conditions associated with physical or mental illness, e.g. arthritis and stroke (the victim is slow or unable to escape the fire), poor eyesight and hearing, systemic diseases such as diabetes (peripheral neuropathy with decreased or no lower extremity pain perception), Alzheimer’s disease (confusion, forgetfulness), and psychiatric illness (depression and suicide). Other risk factors include alcohol and medications such as sleeping pills or tranquilizers. Fire injury and death commonly occur mid-morning and early afternoon.
Burns rank among the 15 leading causes of death in children and young adults.14 The World Health Organization (WHO) reported that, globally, burns accounted for >300 000 deaths annually. In 2007 WHO recognized there was an urgent need for public health action to reduce unintentional injuries, and burns were recognized as a serious global health problem.15 The WHO strategy for burn prevention and care includes improving data sources and surveillance, promoting burn prevention strategies, encouraging innovative pilot programs to address burn prevention priorities in areas with high risk factors, and strengthening burn care services, which include acute care and rehabilitation. Risk factors include cooking at floor level, open kerosene stoves, high population density, poor house construction, and illiteracy.
Passive strategies for prevention, such as smoke alarms, sprinkler systems, building construction codes, regulation of hot water heater temperatures, and flame-resistant sleepwear, have proved effective in industrialized countries, but some segments of the population at risk are not dissimilar from most low- and middle-income countries (LMICs).16 These include poverty, lack of education and employment, large and single parent families, substandard housing including lack of running water, no electricity, crowded living conditions, and racial and ethnic minorities. For any global burn prevention strategy to be successful it must be recognized that differences exist at national, regional and local levels.17 Over 90% of fatal fire-related burns occur in these LMICs.18,19 It is understandable that in many LMICs high priority has been given to disease rather than injury prevention. In many such areas medical resources for burns are limited, and prevention rather than treatment is the priority.
Most importantly, children are at increased risk of burn morbidity and mortality.20,21 Regardless of socioeconomic status, childhood burns are related to the physical environment in which they occur. Behavioral changes can be effective in preventing fire-related burns without changing lifestyle to any great extent. Active prevention even in high-income countries has met with limited success. It makes sense to emphasize specific issues that can modify behavior without the need for excessive use of resources, both dollars and personnel. Any program should be tailored to fit local conditions. Focusing on burn prevention rather than treatment is key to reducing fatalities and injuries. One strategy does not fit all.22
Injury prevention comes of age
A seminal article in modern injury science was published by Haddon in 1968.23 He identified three phases of an injury event:
1 Pre-event: preventing the causative agent from reaching the susceptible host.
2 Event: includes transfer of the energy to the victim. Prevention efforts in this phase operate to reduce or completely prevent the injury.
3 Post-event: determines the outcome once the injury has occurred. This includes anything that limits ongoing damage or repairs the damage. This phase determines the ultimate outcome.
Haddon then created a matrix of nine cells which enabled the three events of the injury to be analyzed against the factors, related to the host, the agent or vector, and the environment24 (Table 4.1). This is a very useful tool for analyzing an injury-producing event and recognizing the factor(s) important in its prevention. Haddon also proposed 10 general strategies for injury control (Table 4.2).24
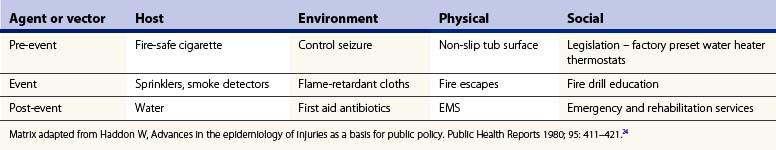
Table 4.2 General strategies for burn control
General Strategies for Burn Control from Haddon W, Advances in the Epidemiology of Injuries as a Basis for Public Policy. Public Health Reports 1980; 95: 411–421.24
Burn intervention strategy
The emergence of the science of prevention has turned attention away from individual ‘blame’ and the attitude that society has no part in the promotion of prevention to the concept that sociopolitical involvement is necessary.25
All burn injuries should be viewed as preventable. Public health is defined as the effort organized by society to protect, promote, and restore the people’s health.26 The public health model of injury prevention and control is divided into:
Primary prevention is preventing the event from ever occurring. Secondary prevention includes acute care, rehabilitation, and reducing the degree of disability or impairment as much as possible. Tertiary prevention concentrates on preventing or reducing disability. Disability prevalence and loss of productive activity are important outcome measures. There are both active and passive prevention strategies. Passive or environmental intervention is automatic: the host requires little to no cooperation or action. This is the most effective prevention strategy. Examples include building codes requiring smoke alarms, sprinkler installation, and factory-adjusted water heater temperature. Active prevention measures are voluntary; emphasize education to encourage people to change their unsafe behavior, and require repetitive educational measures to maintain individual action. Herein lies its weakness. Project Burn Prevention was a program funded by the Consumer Product Safety Commission (CPSC) in 1975.27 It was undertaken to determine whether a burn prevention program would reduce burn deaths by using an educational program and media messages involving a large population base. The author concluded that there was no reduction of burn incidence or severity in their study with either the school education program or the media campaign. Education to bring about and maintain personal responsibility was not sufficient. Active prevention is the least effective and most difficult strategy to maintain, especially over a long period. Examples are a home fire-drill plan, and wearing goggles and gloves when handling toxic chemicals. Passive strategies are not always successful, however: a homeowner may raise a water heater thermostat and a sprinkler system or smoke alarm must be maintained. Once surveillance data have been established and collected, prioritizing high-risk burn groups is necessary in order to identify intervention strategies.
The five Es of intervention are Engineering, Economic, Enforcement, Education, and Evaluation:28
Related posts:
Stay updated, free articles. Join our Telegram channel

Full access? Get Clinical Tree


