Fig. 55.1
Zucker rats used in the study
The Model
Surgical Technique
The prophylactic release procedures were performed at 6 weeks of age in all rats before the onset of diabetes mellitus, which was confirmed by blood sampling. The surgery day was regarded as day zero for all rats.
Tarsal Tunnel Release
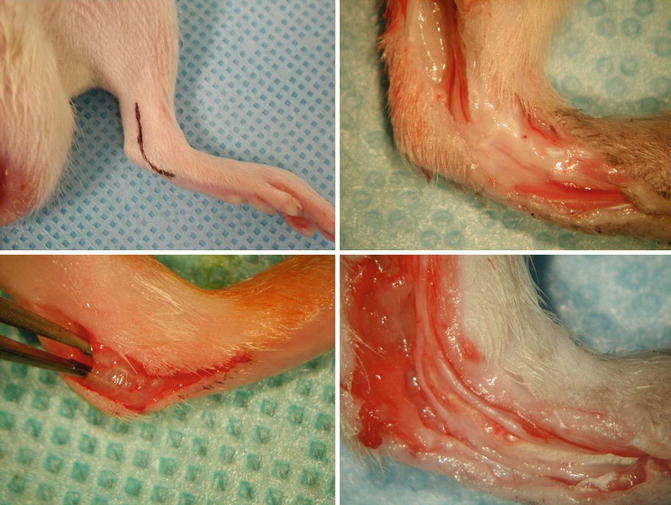
The tarsal tunnel (TT) and the tibial nerve entering this tunnel were exposed using an incision on the medial aspect of lower third of the left leg (Fig. 55.2). The tarsal ligament is incised and tarsal tunnel was released longitudinally and the medial plantar nerve, the lateral plantar nerve and the calcaneal branch of the tibial nerve were exposed preserving their continuity.


Fig. 55.2
An incision was made on the medial aspect (upper left) and the tarsal tunnel was exposed (upper right). The tunnel was incised (lower left) and the medial and lateral plantar nerves were freed (lower right)
Common Peroneal Nerve Release
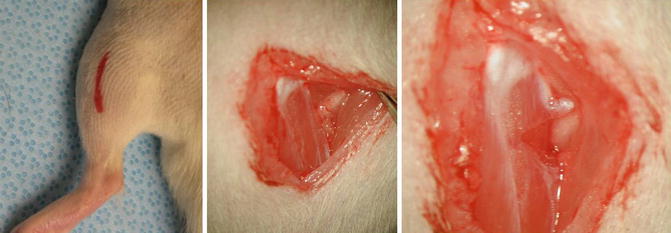
The common peroneal nerve (CPN) was exposed using an incision on the lateral upper third of the left leg (Fig. 55.3). The CPN was dissected towards its entrance, which is between the biceps femoris and the lateral head of gastrocnemius muscles. The nerve is decompressed by freeing it from the surrounding tissue. Further dissection of the nerve exposed its superficial peroneal (SP) and deep peroneal (DP) branches, which were also freed from their surrounding tissue.


Fig. 55.3
An incision is made on the lateral aspect of the leg (left). The common peroneal nerve is exposed at its entrance between biceps femoris and lateral head of gastrocnemius muscle (middle) and the nerve is freed from the surrounding structures (right)
Experimental Design
Thirty Zucker rats were used in this study in six groups, five in each (Table 55.1). The total lifespan of Zucker rats used in our study is shorter than that of their lean littermates and suffer from complications of diabetes and may die earlier. Based on the experience from our previous studies, we have observed that these diabetic rats are affected by the complications of the diabetes and cannot even tolerate anesthesia due to overt diabetes, which was confirmed by high blood glucose level. Therefore, while designing our study, we have divided the rats into short-term and long-term follow up groups as they may die earlier.
Table 55.1
Experimental design
Groups | Operation | Follow-up period (weeks) | |
|---|---|---|---|
Short-term follow up groups | 1 | TTR | 12 |
2 | TTR/CPNR | 12 | |
3 | – | 12 | |
Long-term follow-up groups | 4 | TTR | 24 |
5 | TTR/CPNR | 24 | |
6 | – | 24 |
Groups
Short-Term Follow-Up Groups
In group Group 1 (n:5), the rats underwent TT release (TTR) procedure on their left legs and followed for 12 weeks. In Group 2 (n:5), TTR and CPN release (CPNR) procedures were performed and the rats were followed for 12 weeks. In Group 3 (n:5), the rats were not operated and followed for 12 weeks. These rats served as short-term controls.
Long-Term Follow-Up Groups
In group Group 4 (n:5), the rats underwent TT release (TTR) procedure on their left legs and followed for 24 weeks. In Group 5 (n:5), TTR and CPN release (CPNR) procedures were performed and the rats were followed for 24 weeks. In Group 3 (n:5), the rats were not operated and followed for 24 weeks. These rats served as long-term controls.
Functional Evaluation
Clinical Assessment
Pin prick test, toe-spread test and walking tract analysis were used for functional evaluation and Somatosensory evoked potential test (SSEP) for electrophysiological evaluation.
Pin Prick Test
This test was used in all rats at 12 weeks and in groups 4, 5, and 6 at 24 weeks. The pin-prick test was performed by applying pinching stimuli to the hind-limb skin from the knee to the toes until a withdrawal reflex of the extremity was obtained in response to the pain stimulus [7]. The withdrawal reflex was graded as 1 when obtained above the knee, as 2 when obtained distal to ankle and proximal plantar region and 3 when obtained at the toe level. The grade was accepted as 0 in the absence withdrawal reflex.
Toe-Spread Test
The TS test was performed at the same time as the PP testing to evaluate motor recovery. The following scores were used to note the rats’ response when they were raised from their tails; the absence of any movement was graded as “0”, the presence of any sign of toe-spread was accepted as grade “1”; toe abduction as grade “2”, and both abduction and extension of the toes were accepted as grade “3” [7].
Walking Track Analysis (WTA)
WTA was performed at 12th week for the short-term and 24th week for the long-term follow-up groups before sacrifice. The animals were placed on an 8.2 × 42 cm walking track that was darkened at one end. White paper was laid on the track. The hind paws of the rats were dipped in black ink, and the footprints were left on the papers as they walked through the track. The sciatic function index (SFI) was calculated for each animal on the normal and experimental sides using the parameters as the distance from the first to the fifth toe (toe spread), the distance from the second to the fourth toe (the intermediary toe spread), and the distance from the heel to the third toe (the print length) by Bain – Mackinnon – Hunter SFI formula [8].
Somatosensory Evoked Potential (SSEP) Test
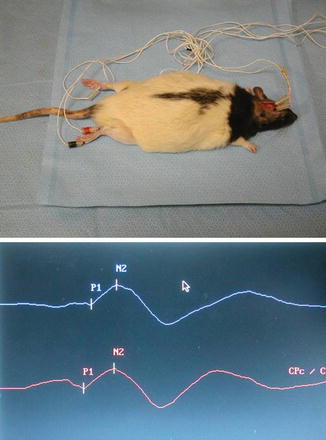
Electrophysiological assessment was performed by somatosensory evoked potential (SSEP) evaluation at postoperative week 12 at short-term follow up groups and 24 at long-term follow-up groups under general anesthesia. A Bio-Logic A-PAC 486 computer (Bio-Logic Systems Corp, Chicago, IL) was used for testing. Two stimulating electrodes were placed, one being at the first web space and the other posterior to the lateral malleolus in a subcutaneous plane at the limb to be evaluated (Fig. 55.4). The ground electrode was placed posterior to the lateral malleolus on the contra-lateral limb. Two burr holes were drilled on both sides of the sagittal suture over the parietal bone, and recording electrodes were placed over the parietal cortex (the active electrode over the contra-lateral cortex). The cortical SSEP responses were recorded bilaterally for the operated and non-operated sides.


Fig. 55.4
Placement of electrodes on the rats for SSEP evaluation (upper). P1 and N2 waves obtained by SSEP test (lower)
The positive and the negative potentials of the waveform morphology in the SSEP measurement were obtained and the initial negative wave was marked as N1 and the following positive wave as P1. The second negative potential was marked as N2. P1 and N2 potentials were used for comparison of sensory recovery between the groups as P1 and N2 potentials are the most robust and consistent potentials (Fig. 55.4). The operated (left) to non-operated (right) side ratios were obtained for P1 and N2 waves in each animal. Higher ratios indicated impaired neurosensory functions.
Histomorphometric Evaluation
Evaluation of Gastrocnemius Muscle Atrophy
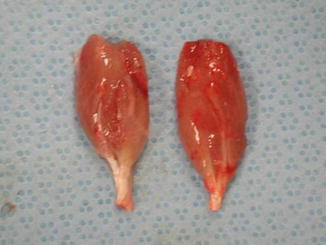
Gastrocnemius muscles were harvested from both legs from rats of short-term follow up groups at 12 weeks and from long-term follow up groups at 24 weeks following sacrifice and wet-muscle weight measurements were taken immediately (Fig. 55.5). The wet weight of the operated site was compared with the non-operated contralateral side and the ratio is calculated as the gastrocnemius muscle index (GMI).


Fig. 55.5
Gastrocnemius muscles were harvested after sacrifice from both the left and right sides
Statistical Analysis
Statistical analysis of the results was performed using the SPSS 11.0 software for Windows. The short-term and long-term follow-up groups were evaluated separately within themselves. Kruskal-Wallis test was used to evaluate the differences between the groups in terms of clinical test results, the sciatic function index measurements, the electrophysiological analysis results, and the muscle weight measurements. For evaluation of parameters between two groups Mann-Whitney-U test was used. The left and the right sides of the rats were compared using Wilcoxon Signed Rank Test.
Results
Functional Evaluation
Pin-Prick Test
Pin-prick test results are given in Table 55.2. There was not any significant difference between controls and surgical release groups at both postoperative 12 and 24 weeks (p > 0.05).
Table 55.2
Pinprick and toe-spread test results in all groups
Groups | Pin prick test 12th week 24th week | Toe-spread test 12th week 24th week | ||
|---|---|---|---|---|
1 | 3.00 ± 0.00 | – | 3.00 ± 0.00 | – |
2 | 3.00 ± 0.00 | – | 3.00 ± 0.00 | – |
3 | 3.00 ± 0.00 |
|||


