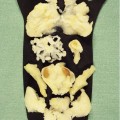
Fig. 6.1
Procedure of isolating MSCs from fresh human fat tissue sample by (a) enzymatic digestion and (b) centrifugation. (c) The suspended tissue has been collected and cultured in a proper medium
ATMSCs with multilineage capacity were isolated as earlier [18]. Fat tissues were originally collected from consented donors and tested for HIV, HBV, HCV, and VDRL. Samples were collected in apposite container including DMEM/F12 (Gibco, Grand Island NY, USA), FBS (10 %, Gibco, Grand Island NY, USA), and gentamicin (50 μg/ml). Tissues were successively transferred to the laboratory where they were placed into Petri dishes and washed with a PBS-streptomycin-penicillin solution three times; then samples were washed again in PBS with no antibiotic and immersed into a basic medium composed of DMEM/F12 (85.025 mL), FBS (5 %, 10 mL), HEPES (15 mM, 1.5 mL, 1 M), NaHCO3 (14 nM, 0.35 mL, 4.103 nM), biotin (33 μL, 1.65 mL, 2.103 μM), d-panto (17 μM, 0.85 mL, 2.103 μM), gentamicin (40.000 μg/mL, 0.125 mL), and penicillin-streptomycin (200×, 0.5 mL). Samples were selectively worked to remove foreign tissues, were finely chopped, and transferred into an enzymatic solution composed of dispase-collagenase solution (3:1 ratio) and incubated for 90 min at 37 °C. Successively, the sample was centrifuged (Universal 32, Zentrifugen-Germany) for 5 min at a speed of 3,000 rpm, the floating materials were removed, and the sedimentation was collected and filtered by a cell strainer with diameter of 70 μM (BD FalconTM). This filtered solution was newly centrifuged at a speed of 3,000 rpm for 5 min, the floating suspension was removed, and the sediment was collected by adding the basic medium; a small fraction of cells were collected and counted by Trypan Blue (Sigma). The rest of cells were successively cultured into T-25 cm2 flask (Nunc, Wiesbaden, Germany) with a medium composed of DMEM/F12 (81.51 mL), FBS (10 %, 10 mL), HEPES (15 mM, 1.5 mL, 1 M), NaHCO3 (14 nM, 0.35 mL, 4.103 nM), biotin (33 μL, 1.65 mL, 2.103 μM), d-panto (17 μM, 0.85 mL, 2.103 μM), human insulin (66 nM, 1.95 mL, 34.102 nM), triiodo-l-thyronine (1 nM, 65 μl, 0.065 mL, 1.5.103 nM), human transferrin (10 μg/mL, 2 mL, 500 μg/mL), and gentamicin (40.000 μg/mL, 0.125 mL). Cell cultures were incubated into an apposite incubator at 37 °C with 5 % CO2. The medium was replaced every 3 or 4 days. After a few days, a colony with the typical spindle-like shape started to form, and at 80–90 % of confluence cells were harvested by enzymatic digestion by using a combination of Trypsin-EDTA (Gibco BRL, USA); suspended cells were centrifuged for 5 min at 3,000 rpm, and the pellet was removed and cultured in T-25 cm2 flask with DMEM plus 10 % FBS. The average amount of adherent cells was 0.9 (±0.37) × 106 cells per ml of crushed adipose tissue. Cell viability at the time of passage was nearly 100 %. The MSCs were tested for specific CD markers to confirm their phenotype identity; cells resulted negative for hematopoietic cell markers including CD14, CD45, and HLA-DR and were positive for exclusive markers such as CD13, CD44, CD73, CD90, CD105, and CD166. MSCs were subcultured several times and photographed.
6.2.1.1 CD Markers Profile (Fig. 6.2)
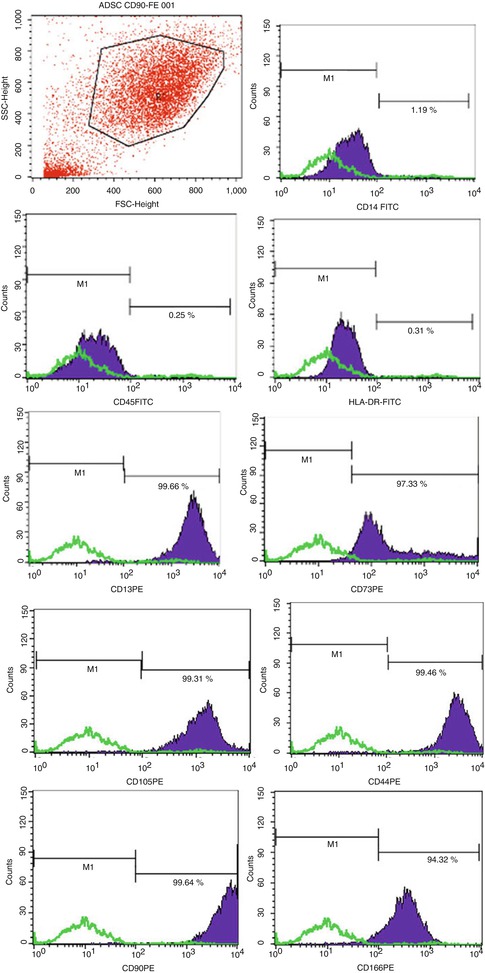
Fig. 6.2
ATMSCs have been tested by flow cytometry to ensure their specific phenotype. Markers that were negative are CD 45-14 and HLA-DR. 6 CD markers that were positive indications of the type of MSC population are CD13, CD73, CD105, CD44, CD90, and CD166
A total of 9 cell cultures were harvested at the second generation and tested to corroborate their phenotypic characterization by flow cytometry procedures. hATMSCs were previously tested to three specific hematopoietic markers CD14, CD45, and HLA-DR (negative) and subsequently tested for markers such as CD13, CD44, CD73, CD90, CD105, and CD166 (positive). By these results, it is clearly confirmed that hATMSCs share similarities with their counterparts from hUCB or hBM as one can find in other published works [16, 18, 19, 50].
Second-generation hATMSCs were harvested at day 15 and stained with Giemsa stain in order to confirm their morphology and profile (Fig. 6.3). The hATMSCs show the unique classic spindle-like shape of distinctive MSCs. These cells show an amazing survival grade and a high expansion and proliferative rate; we successfully obtained over six dozen cultures from a single fat tissue sample; from a mother cell culture, it was possible to reach up to the seventh to ninth generation with cultures able to maintain a constant rate growth with a very low number of losses.
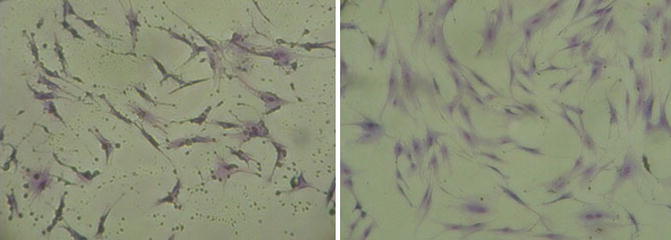
Fig. 6.3
(Left and right) Fibroblast spindle-like shape of ATMSCs, the morphology of these cells is typical of all MSCs population from BM, UCB, or placenta. ATMSCs are high proliferative cells with strong adherence ability (×200)
6.2.2 In Vitro Differentiation of hATMSCs to Adipocytes
MSCs were harvested by enzymatic digestion by Trypsin-EDTA at the second passage and were transferred in flask culture with a specific adipogenic medium containing DMEM/F12 (80.945 mL), HEPES (15 mM, 1.5 mL, 1 M), NaHCO3 (14 nM, 0.35 mL, 4.103 nM), biotin (33 μL, 1.65 mL, 2.103 μM), d-panto (17 μM, 0.85 mL, 2.103 μM), human insulin (66 nM, 1.95 mL, 34.102 nM), triiodo-l-thyronine (1 nM, 65 μl, 0.065 mL/1.5.103 nM), human transferrin (10 μg/mL, 2 mL, 500 μg/mL), gentamicin (40.000 μg/mL, 0.125 mL), isobutyl-methylxanthine (0.005 μg/mL, 0.2 mL), hydrocortisone (100 nM, 0.365 mL, 365 μL), and dexamethasone (10−8 M, 10 mL) (all from Sigma-Aldrich, USA). After a period of 31 days, cells appeared with the typical round shape containing small vesicles of fat; cells were tested positive for specific adipocyte stains, Oil Red and Nile red. Adipocytes were subcultured several times and photographed.
6.2.2.1 Cytochemical Stain: Oil Red
At 90 % confluence, second-generation hATMSCs were harvested by enzymatic digestion and induced to differentiate into adipocytes, by using a specific adipogenic medium [17, 19]. Cells stay in culture for almost a month and started to change shape at the second week to assume the complete mature adipocyte conformation at the end of 4th week showing the typical fat droplets inside their cytoplasm. The adipocyte phenotype was confirmed by using two specific cytochemical stains Nile Red and Oil Red (Fig. 6.4).
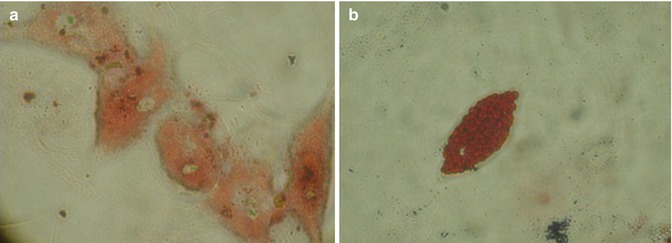
Fig. 6.4
At 99 % confluence, ATMSCs have been harvested and differentiated into adipocytes. Cells remain in culture for 1 month showing (a) the typical round shape with fat drops in their cytoplasm. (b) Mature adipocytes stained by Red Oil
6.2.2.2 Nile Red by Fluorescence Electronic Microscope
At 90 % confluence, second-generation hATMSCs were harvested by enzymatic digestion and induced to differentiate into adipocytes, using a specific adipogenic medium [17, 19]. Cells stay in culture for almost a month, they started to change shape at the second week to assume the complete mature adipocyte conformation at the end of 4th week showing the typical fat droplets inside their cytoplasm. At mature confluence, cells were fixed in 1 % paraformaldehyde in PBS and stained by Nile Red following the described procedure.
The reagents used are PBS 1 ml and permeabilization reagent 0.1 % Triton X in PBS for each specimen, containing 1 μl staining solution Nile Red fluorescence. Slides were washed once in PBS in jar for 3 times for 5 min; once dried, it was added 100 μl of permeabilization reagent per slide to cover all sections for 1 min. Slides were washed in jar with PBS for other 3 min; once dried, it was added 1 μl of staining solution 1 per slide with 1 ml PBS to cover all sections for more than 10 min. Slides were dried, and it has been mounted the tissue by using Dako mounting medium, and cover slips sealed with nail varnish.
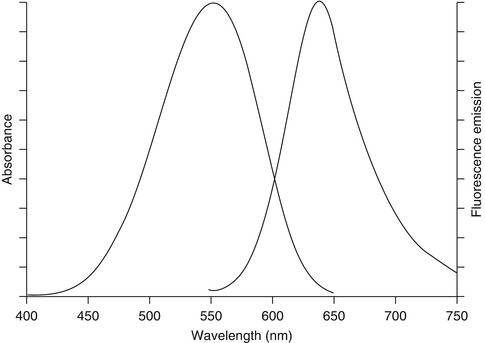
Nile Red staining confirmed that the cell cytoplasm contains lipid particles and is very specific. This is the most effective method to identify cells as fat cells (Fig. 6.5).
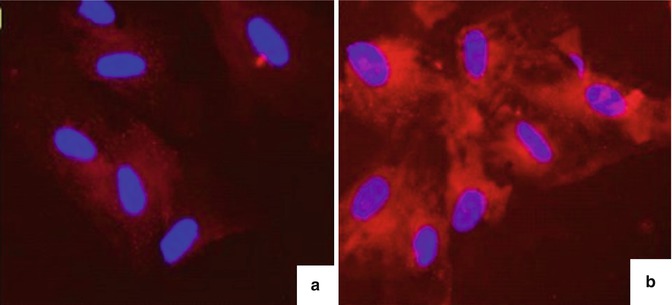
Fig. 6.5
Results of Nile Red staining for adipocytes after differentiation. (a) Negative control samples, mesenchymal stem cells. (b) Adipocytes are differentiated after staining with Nile Red showing that the cytoplasm of many cells appeared red–orange lipid particles, lipid particles accounted for nearly all the cell cytoplasm, and the nucleus was push offset to one side of the cell
6.2.3 In Vitro Differentiation of hATMSCs to Osteoblasts
MSCs from adipose tissue were harvested at the second passage and were induced to differentiate into osteoblasts using a specific osteogenic medium composed of IMDM (63.05 mL, 13.05 %), penicillin-streptomycin (8.70 ml), FBS (13.05 mL), dexamethasone (10.0 mL, 10−7 M), ascorbic acid (1.00 mL, 0.05 mg/mL), β-glycerol phosphate (2.00 mL, 10 mM) (all from Sigma-Aldrich, USA), vitamin D2 (2.00 mL, 2.10−8 M, Mekopharm-Vietnam), and FGF9 (0.20 mL, 10 ng/mL, Sigma-Aldrich, USA). After 3 weeks in osteogenic medium, cells tested positive for cytochemical stains AP, AR, and VK and for osteocalcin marker by RT-PCR; part of the osteoblasts were harvested and cultured on coral scaffold Porites lutea and scanned by SEM and resulted positive for AP.
6.2.3.1 hATMSCs Undergo Osteoblastic Differentiation: Cytochemical Stains AR, AP, and VK (Fig. 6.6)
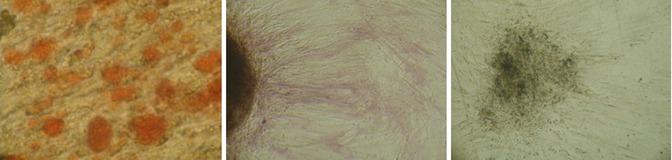
Fig. 6.6
To confirm ATMSCs’ multipotent capacity, they were induced to differentiate into osteocells. After 21 days of culture, the cells were stained by classic cytochemical stains. (Left) AR, (Middle) AP, (Right) VK
This part of the project was to confirm the hATMSCs’ capacity for differentiation toward osteoblast phenotype. The cells were harvested at the second passage by enzymatic digestion and cultured with a proper osteogenic medium [10]. New cell lines were collected after 3 weeks ca. and stained by classic cytochemical stains AR, AP, and VK to prove calcium matrix and hydroxyapatite nodules and filament deposits. Cells revealed a strong and consistent osteogenic activity.
6.2.4 In Vitro Transdifferentiation of Human Adipocyte Cells to Osteoblasts
Adipocytes from hATMSCs were directly obtained by adding into cell flask cultures at the second passage, a specific osteogenic medium composed of IMDM (63.05 mL, 13.05 %), penicillin-streptomycin (8.70 mL), FBS (13.05 mL), dexamethasone (10.0 mL, 10−7 M), ascorbic acid (1.00 mL, 0.05 mg/mL), β-glycerol phosphate (2.00 mL, 10 mM) (all from Sigma-Aldrich, USA), vitamin D2 (2.00 mL, 2.10−8 M), and FGF9 (0.20 mL, 10 ng/mL). After 3 weeks in osteogenic medium, cells tested positive for cytochemical stains AP, AR, and VK and for osteocalcin marker by RT-PCR; part of the of osteoblasts were harvested and cultured on coral scaffold Porites lutea and scanned by SEM and resulted positive for cytochemical stain Giemsa and AP.
6.2.4.1 Preparation of Fibrin Gel
Fibrin gel was obtained by combining two components, fibrinogen and thrombin, extracted from peripheral blood of healthy and consented donors. Blood was tested negative for HIV, HBV, HCV, and VDRL.
6.2.4.2 Collection of Fibrinogen
The blood was centrifuged at 3,000 rpm for 5 min. About 10 ml of serum was centrifuged at 3,000 rpm for 5 min. The solution was filtered using a filter with a diameter of 0.20 μm (Minisart Sartorius®) and placed into a new sterile tube and incubated at 4 °C for one hour and at −20 °C [19].
6.2.4.3 Collection of Thrombin
Blood samples were centrifuged at 3,000 rpm for 5 min, and 10 mL of serum was collected. Serum was centrifuged at 3,000 rpm for 5 min. The solution was collected and filtered by a diameter 0.20 μm filter (Minisart Sartorius®) into a new sterile tube and incubated at 4 °C for one hour and overnight at −20 °C. Then the tube was thawed at a temperature of 4 °C; PBS solution was added (ratio 1:9). Acetic acid was added 1 % to adjust the pH at 5.3. The solution was allowed to stand for 30 min to precipitate. Afterward it was centrifuged at 3,000 rpm for 5 min. The sediment on the bottom was removed and collected. PBS was added (ratio 1:9). Na2CO3 0.1 M was used to adjust to pH 7.0. The whole was placed in a thermostatic bath at 37 °C for 15 min, and CaCl2 (0.01 M) was added to create clots. Clots were removed and discharged, while the remaining liquid that is thrombin was collected and preserved at a temperature of −20 °C [40].
6.2.4.4 Seeding hFTMSCs onto Fibrin Gel
Fibrin gel is formed by the combination of fibrinogen and thrombin (ratio of 1:1). hFTMSCs, at second passage, were collected by enzymatic digestion, a solution of Trypsin-EDTA (0.25–0.02 %) (Fig. 6.7). Cells were centrifuged at 3,000 rpm for 5 min, and a fibrinogen solution was added to cells deposited at the bottom. The cell-fibrinogen solution was moved into 30 cm diameter Petri dishes, and additional thrombin was poured (ratio 1:1); the whole was manually mixed and rested for few minutes for it to become a homogeneous compact formation. After one day, the cell culture medium was replaced with pre-adipocyte differentiation culture medium. After 3 days, the culture medium was replaced by adipocyte differentiation culture medium. After 3 weeks of culture, the cells are tested by inverted microscope, Oil Red staining, and H&E staining for fibrin gel (Fig. 6.8).
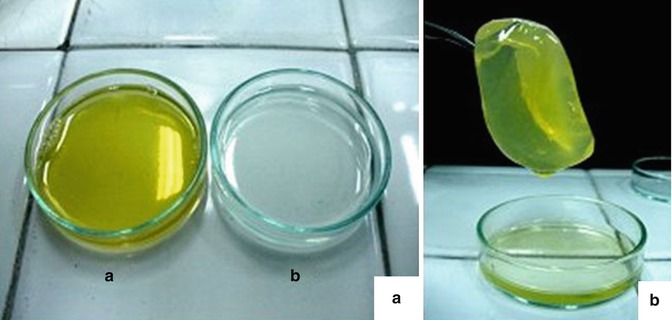
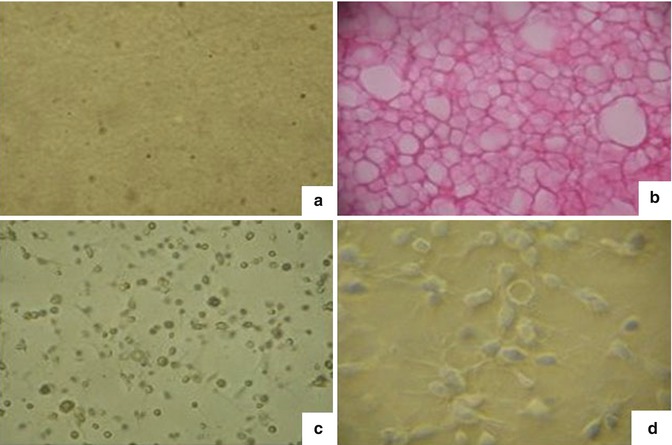
Fig. 6.7
The resulting fibrin gel. (a) Two components were isolated separately (a) fibrinogen and (b) thrombin. (b) The combination of fibrinogen and thrombin with a 1:1 volume within 1–5 min quickly forms a light yellow block of gel that seeded with adipocytes giving an elastic and supple tissue very close to human fat tissue
Fig. 6.8
Create a fibrin gel containing fat cells. (a) The fibrin gel observed under inverted microscope. (b) Fibrin gel was fixed and stained with H&E and showed that the gel contains many holes and cavities suitable for cell adhesion and development within the block of gel. (c) Cell growth inside the gel under inverted microscope shows that cell grew and distributed into several layers within the gel. (d) Cell adhesion and growth on the surface of gel blocks
When mixed, fibrinogen and thrombin (ratio of 1:1) are able to form a block of gel within 5 min; the final result is a fibrin gel that is bright yellow in color and very tough and resilient in consistency. After 21 days culture, hFTMSCs, cultured on fibrin gel using an adipogenic culture medium, are completely differentiated into adult adipocytes.
Oil Red staining directly performed on cells cultured on fibrin gel showed that hFTMSCs are completely differentiated into adipocytes with the typical round shape and the very characteristic cytoplasm containing lipid particles captured by bright red with Oil Red dye (Fig. 6.9).
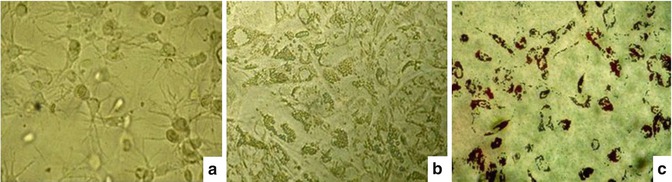
Fig. 6.9
Results of differentiated mesenchymal stem cells into adipocytes on fibrin gel. (a) Cell development and distribution in the gel, the cell’s cytoplasm divided into several branches, well developed in the gel. Cytoplasm of some cells contains many lipid particles. (b) Cells differentiate into adipocytes, adhesion and growth on the surface of gel. Nearly all cells had differentiated into adipocytes with cytoplasm filled with lipid particles. (c) Cells were stained with Oil Red dye directly on the fibrin gel
Fibrin gels containing adipocytes were fixed in 10 % Neutral Formalin Buffer Saline (NBF) solution and stained with H&E. The results show that cells survive and grow well on fibrin gel; within the cell cytoplasm are visible lipid droplets (Fig. 6.10).
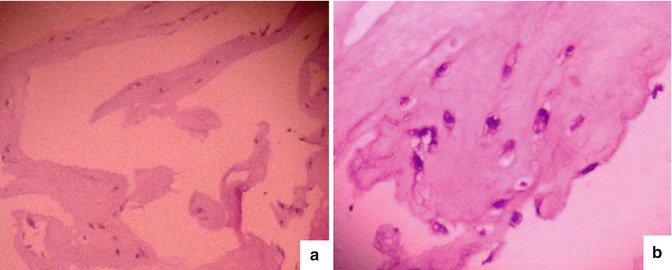
Fig. 6.10
Result of H&E staining for fibrin gel containing adipocytes. (a) Gel containing adipocytes photographed at 100 times magnification with inverted microscope. (b) Gel containing adipocytes photographed at 200 times magnification with inverted microscope. The cells are arrested in purple, and around the nucleus of the cell are gaps that do not color. These were droplets of lipid within the cytoplasm of the cell
6.2.4.5 Preparation and Structural Characteristics of Coral Scaffold Porites lutea (Fig. 6.11 and 6.12)
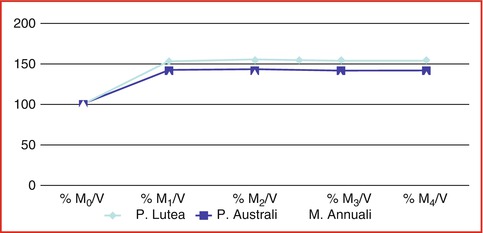
Fig. 6.11
Water loading velocity: % when dried coral blocks were exposed in sterile 0.9 % sodium chloride at boiled temperature with low pressure
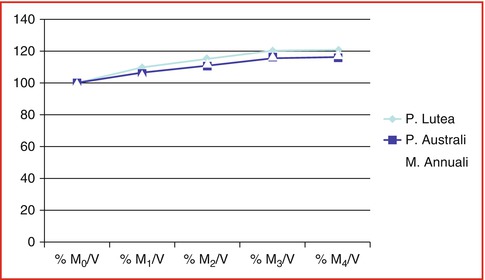
Fig. 6.12
Water loading velocity: % when dried coral blocks were exposed in sterile 0.9 % sodium chloride at room temperature with pressure, chloride at room temperature with high pressure
Natural porous coral, Porites lutea (from the Oceanographic Institute of Nha Trang city VN), was washed in 0.9 % distilled water, lyophilized, and sterilized by gamma ray to 25KGy. Porites lutea shows to have ideal porosity and enough volume fraction with high surface area to carry a high number of cells within and the surrounding host tissues allowing its ingrowth and vascularization. Data are presented as mean ± SE (Tables 6.1, 6.2, and 6.3)
Table 6.1
Density: Coral weight was measured by an electric scale (Sartorius-OSI-BP 124.78312). Their volume was made by a technological rule
Density (cm3/kg) of dried coral rods (mean ± 2 SE) | |
|---|---|
Porites australiensis | 1.3297 ± 0.0439 (60 dried coral blocks) |
Porites lutea | 1.0771 ± 0.0364 (60 dried coral blocks) |
Montastrea annuligera | 1.3752 ± 0.0462 (60 dried coral blocks) |
Table 6.2
Porosity: The porous rates of coral were studied indirectly by weighing both dried blocks and water saturated ones in Thermosi SR 3000, OSI, at 30–40 °C, 40–70 atm
Porosity (%) of coral blocks (mean ± 2 SE) | |
|---|---|
Porites australiensis | 0.4291 ± 0.0167 (60 dried coral blocks) |
Porites lutea | 0.5538 ± 0.0218 (60 dried coral blocks) |
Montastrea annuligera | 0.3665 ± 0.0165 (60 dried coral blocks) |
Table 6.3
Mechanical strengh:strengh was measured at the Nuclear Technology Center of HCMC by Strograph V10 – C Toyoseiki
Mechanical strength (Kg/cm3) of dried coral blocks (mean ± 2SE) | |
|---|---|
Porites australiensis | 68.6638 ± 10.5895 (60 dried coral blocks) |
Porites lutea | 53.6082 ± 10.3835 (60 dried coral blocks) |
Montastrea annuligera | 51.7504 ± 11.5625 (60 dried coral blocks) |
6.3 Seeding hATMSCs and Adipocytes onto Coral Scaffold
MSCs from hAT and adipocytes have been collected at second passage and seeded on coral scaffold and immersed in osteogenic medium; cells were counted by Trypan Blue. Cells have been centrifuged together with the scaffold 5 times at 1,000 g per minute and incubated at 37 °C with 5 % CO2. Media have been changed every 3–4 days. Scaffold has been incubated for 7, 15, and 21 days and stained by Giemsa, H&E, AP, and fluorescence analysis microscope and pictured by SEM.
The specimens are collected and fixed by a fixative buffer solution composed of glutaraldehyde-formaldehyde (0.7 μM/5 mL medium c.ca) and incubated at 37 °C with 0.5 % CO2. The fixed cell tissue is dehydrated with organic solvents acetone or ethanol. Solvents are removed by carbon dioxide at high pressure; once CO2 is also removed, dried specimen is collected and placed on stub using an adhesive such as epoxy resin and sputter coated with gold alloy before examination in the microscope.
Osteoblasts from both sources were seeded onto sea coral scaffold. At day 10 c.ca, osteocells started to produce a compact matrix that does not require enzymatic digestion; therefore, the tissue was manually removed, washed by PBS, and wrapped on corals and incubated for 14 days. SEM pictures clearly show that osteoblasts were able to home deep inside the coral interstices, growing and expanding, and able to interact with their environment. The pictures show an elevated dense population and how osteoblasts have radically changed the morphology of the scaffold where they homed (Fig. 6.11).
6.4 Cytochemical Staining
Mineral matrix deposits and bone nodules of both groups of osteoblasts, from hATMSCs and adipocytes, were evaluated by staining cell cultures by AR, AP, and VK. Adipocyte phenotypes were confirmed by using Nile Red and Red Oil stains.
6.4.1 Alizarin Red Stain Procedure
The presence of calcium deposits was detected by washing cells with cold PBS and fixing them in 10 % NFB solution for 30 min in chemical hood. Cells were rinsed 3 times with distilled water and immerged in 2 % (w/v) solution of Alizarin red for 30 s to 5 min. Cells were rinsed again with distilled water 2–3 times and checked under inverse microscope and pictured.
6.4.2 Alkaline Phosphatase Stain Procedure
The presence of alkaline phosphates was detected by washing cells with cold PBS and fixing them in 10 % NFB solution for 30 min in chemical hood and stained with solution naphthol As-MX-PO4 (Sigma) and Fast Red Violet LB Salt (Sigma) for 45 min in dark at room temperature. Cells were rinsed three times with distilled water and checked by inverse microscope and pictured.
6.4.3 Von Kossa Stain Procedure
The presence of calcium deposits was detected by washing cells with cold PBS and fixing them in 10 % NFB solution for 30 min in chemical hood and stained with 2.5 % silver nitrate (Merck-Germany) for 30 min in a dark place. Cells were rinsed 3 times with distilled water and checked by inverse microscope and pictured.
6.4.4 Oil Red for Adipocytes from hATMSC
At 90 % confluence, second-generation hATMSCs were harvested by enzymatic digestion and induced to differentiate into adipocytes, by using a specific adipogenic medium previously described. Cells stay in culture for almost a month; they started to change shape at the second week to assume the complete mature adipocyte conformation at the end of 4th week showing the typical fat droplets inside their cytoplasm.
6.4.5 Nile Red
Related posts:
 Stem Cell Applications: An Overview
 The Adipose Organ: Morphological Perspectives of Adipose Tissues
 The Role of Adipose Tissue-Derived Stem Cells and of Angiogenesis
 Advantages of the Transplantation of Fat in Plastic and Reconstructive Surgery
 Hand Rejuvenation with Stem Cell Fat Transfer
 Stem Cell Fat Transfer for Mastoplasty Using VASER™ Ultrasound and Office-Devised Stem Cell
Stay updated, free articles. Join our Telegram channel

Full access? Get Clinical Tree


