Fig. 4.1
Varied appearance of chronic sinusitis. (a) Coronal image showing bilateral maxillary sinus mucosal thickening, extending into the outflow tracts (thin arrows). Note the sclerosis and thickening of the surrounding maxillary sinus walls (thick arrow). Axial images in bone window (b) and soft tissue window (c), demonstrating chronic right sphenoid sinusitis, recurrent postoperatively, with opacification with high-density secretions extending through the sphenoid ostium and sclerosis and hyperostosis of the surrounding bone (thick arrow)
Acute infections can cause demineralization of the wall of the sinus when severe, and when the process becomes chronic, reactive sclerosis of the sinus walls occurs [3]. Sclerotic changes often indicate the presence of osteitis, but may also indicate a reactive process [3, 13, 14]. Bony erosion of the sinus margins and lamellae can also occur with aggressive infections, such as invasive fungal sinusitis, or malignancy. Bony remodeling is usually indicative of slow, progressive inflammatory pathology such as mucocele formation or allergic fungal sinusitis, but can also be seen in less aggressive malignancies [13] (Fig. 4.2a, b).
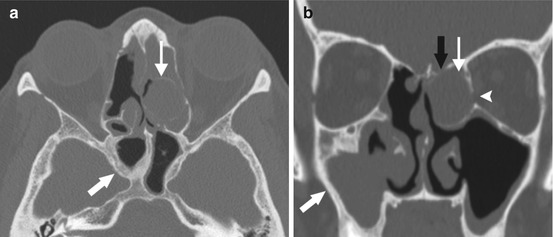
Fig. 4.2
Bony changes associated with chronic sinusitis. Axial (a) and coronal (b) images of a patient with recurrent chronic sinusitis after endoscopic sinus surgery, with thickening and sclerosis surrounding chronic sinusitis within the sphenoid and the right greater than the left maxillary sinuses (thick arrows), as well as bony remodeling and expansion surrounding an opacified left ethmoid air cell, compatible with mucocele (thin arrow). Note the thinning and dehiscence of the left lateral lamella (black arrow) and the left lamina papyracea (arrowhead) from the expansion of the mucocele
CT findings should always be interpreted in conjunction with clinical and endoscopic findings as mucosal thickening is an extremely common incidental finding, which is not necessarily related to infection [4, 5]. Over 80 % of patients with minor URIs have abnormal findings on CT scan [4, 6, 12]. Additionally, patient symptoms and quality of life do not necessarily correlate with extent of disease on imaging [1]. CT findings are important for excluding more serious pathology, such as neoplasm or malignancy that may mimic CRS [1]. Primary indications for imaging include recurrent or refractory disease and unilateral symptoms [14]. Although inflammatory processes can result in unilateral sinus opacification on imaging, when unilateral disease is present, the likelihood of neoplasm should be considered [15]. When a diagnosis of CRS is certain, imaging is usually reserved for refractory sinusitis, complicated sinusitis, CRS with atypical symptoms, for defining sinus anatomy when surgery is planned, or for intraoperative navigation [6, 7]. Most recommend obtaining CT after a course of adequate medical therapy; some also recommend use of a nasal decongestant prior to imaging [3, 13].
Technique
There are many modalities available for obtaining CT images, and these vary in radiation dose, cost, and image quality. Historically, conventional and single slice scanning was previously performed with the patient in the prone position with neck extension, with images obtained in the coronal plane from the anterior wall of the frontal sinus through the posterior wall of the sphenoid sinus, so-called “direct coronal” image acquisition. Axially acquired coronal reconstructed images on single slice scanners were previously inferior to direct coronal helical images because of “Stair-step” artifacts [6, 9]. However, current generation multi-slice, multichannel CT scanners can acquire submillimeter axial slices with contiguous coverage of the entire volume, allowing excellent quality reconstructed images from the same data set in any desired plane [9, 16]. Scanning in the axial plane with multiplanar reformations in coronal and sagittal planes is now considered the standard of care, which is preferable, as the supine position is more comfortable for the patient, and reconstructed coronal images are free of dental amalgam artifacts [9]. In recent years, the use of cone-beam CT has been expanded to in-office use for sinonasal evaluation. Advantages include patient convenience, decreased cost, and significant reduction in radiation exposure. However, disadvantages include diminished soft tissue visibility, increased propensity for X-ray scatter/artifact, and a concern for over usage when scanning is so readily available [6, 17].
The appearance of CT images is affected by window width and level that are arranged according to Hounsfield units. A Hounsfield unit (HU) is defined as a unit of X-ray attenuation based on water where air has a value of −1,000, water has a value of 0, and compact bone/metallic density has a value of +1,000. To obtain the highest bony definition of the paranasal sinuses, the windows of the scan are set between 1,500 and 2,000 HU with a center, or level, of +100 to +300 HU, so-called bone windows. Separate images reconstructed with soft tissue window settings are helpful in assessing sinonasal masses, fungal sinus disease, or complications of sinusitis [5, 11].
The three main planes of imaging include coronal, axial, and sagittal. Each plane of imaging can be helpful in defining paranasal sinus anatomy. The coronal view optimally demonstrates the OMC, the ethmoid roof, and the relationship of ocular structures, and it best correlates with the endoscopic surgical approach. Axial views are particularly useful in determining the drainage pathway of the frontal sinus and the course of the sphenoid septum. The parasagittal view is indispensible to a surgeon’s ability to assess the complex frontal recess anatomy and is helpful when assessing the pneumatization pattern of the sphenoid. Therefore, for every sinus CT in patients with chronic rhinosinusitis, the study should contain thin section axial bone window images through the sinuses, with thin reconstructed coronal and sagittal reconstructions, as well as axial soft tissue window images reconstructed with increased slice thickness, for improved soft tissue resolution (Fig. 4.3a–d).
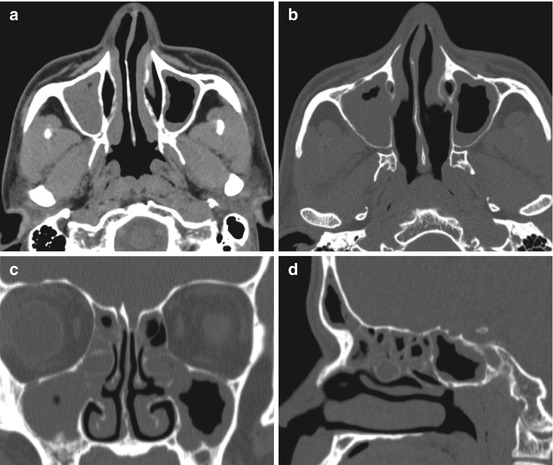
Fig. 4.3
Images generated and sent to PACS for every sinus CT performed should include: (a) axial soft tissue window images in thicker slices for improved soft tissue resolution, i.e., 2.5 mm thickness, (b) axial thin section bone window images reconstructed at thin submillimeter (i.e., 0.625 mm) thickness, and (c) coronal, and (d) sagittal thin section bone window images reconstructed at submillimeter to 1 mm thickness. Images should include the facial soft tissues and tip of the nose, without tape or tubing distorting facial soft tissues, so that images may be used for image guidance software
Staging
There are multiple radiographic staging systems (Lund–Mackay, Kennedy, Harvard, May) that have been used to assess radiographic disease severity. Notably, they are not designed to be used to diagnose CRS. The Lund–Mackay staging system (Table 4.1) is the most commonly used system. Its use has been recommended by the American Academy of Otolaryngology Task Force on Rhinosinusitis for staging and has been found to be useful in determining radiographic cutoffs for a truly “diseased” paranasal sinus CT scan. This system quantifies disease severity on a scale from 0 to 2 for six regions, which are scored bilaterally, for a potential total score of 24 [4]. Despite a widespread consensus that staging for chronic rhinosinusitis would be helpful, the utility of radiographic staging has been difficult to demonstrate [8]. Symptom scores for CRS typically fail to correlate with CT scan findings and thus with CT scan stage [8]. Investigators have suggested that radiographic cutoffs for an abnormal CT scan should be based on a score of 4 or greater in the presence of appropriately related sinonasal symptoms [2]. These cutoffs have shown a sensitivity of greater than 85 % and a positive predictive value greater than 80 % in the diagnosis of CRS [2].
Table 4.1
Lund–Mackay CT scoring system
Regions | Score |
|---|---|
Maxillary sinus | 0 – No evidence of opacification |
Anterior ethmoid sinuses | 1 – Partial opacification |
Posterior ethmoid sinuses | 2 – Complete opacification |
Frontal sinus | **OMC is scored 0 if occluded or 2 if not occluded |
Sphenoid sinus | |
Ostiomeatal complex |
Radiation
One of the main concerns associated with CT scanning is radiation exposure and its anticipated effects on other organ systems. Cumulative exposure to radiation correlates with an increase in the incidence of malignancies. With respect to sinus CT scans, the primary concerns are thyroid cancer and cataract formation [5, 7, 18]. The exact dose of radiation to which a patient is exposed is dependent on patient size and is also largely a function of the parameters that are often set by the manufacturer of the scanner or the scanning institution. These settings are often higher than necessary to achieve a comparable image and vary greatly across manufacturers and institutions [9, 16, 19, 20]. Although the risk of malignancy or other adverse effect is perceived to be small, the availability of CT imaging technology usage has greatly increased, and over usage is a concern. It has been suggested that up to 2 % of cancers in the US could be attributable to radiation exposure associated with CT imaging [20]. The age of exposure is highly relevant, with younger patients having an increased risk for cancer incidence and mortality [18, 21].
A standard head CT has an estimated effective radiation dose of 2 mSv (chest X-ray – 0.1 mSv), which is equivalent to approximately the natural background radiation an individual would be exposed to in 8 months [22]. The mean dose to the lens when obtaining images in the axial plane has been shown to be 24.5 mGy compared to 35.1 mGy in the coronal plane [9]. There is a threshold dose of 0.5–2 Gy for detectable lens opacities, with cataracts occurring after dosages of 2–10 Gy [9, 18]. Studies have shown that even after multiple CT examinations, the radiation dose to the lens is still well below the known thresholds of clinical damage [5]. The mean dose for the thyroid gland has been shown to be 1.4 mGy in the axial plane compared to 2.9 mGy in the coronal plane [9]. Various studies have documented maintenance of image quality with a reduction in radiation dose [9]. Multi-slice axial imaging reduces radiation exposure when compared to direct coronal imaging, and cone-beam technology is believed to substantially decrease effective dose [9].
Magnetic Resonance Imaging (MRI)
MRI has been used as a complementary exam to CT for the evaluation of the paranasal sinuses. Its advantages include superior soft tissue characterization and no radiation exposure. It is not routinely used for the assessment of CRS due to cost, longer imaging time, and lack of bone detail [5–7, 11]. MRI has also been found to be potentially overly sensitive to mucosal thickening. At least 20–40 % of patients undergoing MRI of the head are found to have edematous tissue of the paranasal sinuses as an incidental finding [3]. However, MRI has been shown to correlate very well with CT when paired CT and MR images of the paranasal sinuses were assessed with the Lund–Mackay system. Further studies are needed to establish the role for MRI in the diagnosis of CRS [2, 6].
Indications for MRI include cases of aggressive sinus infection with ocular and/or intracranial complication, developmental lesions (i.e., meningoencephalocele), or for the evaluation of a sinonasal mass [5, 6]. Any sinonasal mass that does not appear typical for benign sinonasal polyposis should undergo further investigation with MRI, as it can discriminate neoplasm and other nonneoplastic masses from retained mucous or inflammatory disease and can occasionally separate mucosal thickening from retained secretions (Fig. 4.4a, b). It is particularly valuable in assessing for dural or orbital invasion or extension [3, 23]. It has also been shown to be useful for the evaluation of patients who have undergone prior osteoplastic flap with obliteration with ongoing symptoms.
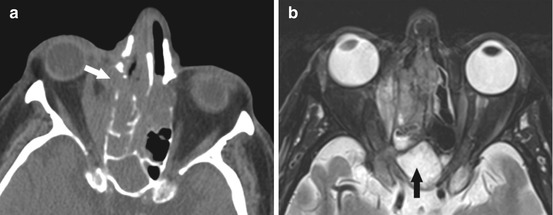
Fig. 4.4
(a) Axial CT images showing a polypoid soft tissue mass centered in the right sinonasal cavity, crossing midline to the left, with extrasinus extension into the right orbit and destructive non-expansile bony changes (arrow). This is concerning for an aggressive process (malignancy or aggressive infection in the appropriate clinical scenario). MRI should be obtained. (b) Axial T2w MR images showing an infiltrative mass centered in the right ethmoid air cells, extending into the right orbit, relatively T2 hypointense compared to the benign post-obstructive sinonasal secretions in the sphenoid sinus (black arrow). This was a case of sinonasal melanoma
A standard MRI protocol includes obtaining thin section T1-weighted (T1w) images before and after gadolinium administration, with fat saturation on the postcontrast images, and T2-weighted (T2w) images in the axial and coronal planes. MRI signals of sinonasal secretions have been related to multiple properties such as viscosity, fat, metal content, and protein concentration. In general, watery secretions appear hypointense on T1w images and hyperintense on T2w images. As the protein concentration increases and free water decreases, the signal intensity on T2w images decreases, presumably due to cross-linking between glycoprotein molecules [11, 12, 24]. Thus, sinonasal secretions in acute sinusitis, which consist of 95 % water and 5 % proteins, usually demonstrate low intensity on T1w and high intensity on T2w images [12]. In contrast, in chronic sinusitis, secretions often have a higher protein concentration and less free water, and this may result in different patterns of MRI signal intensity [5]. Generally speaking, four signal intensity patterns in CRS are possible:
Hypointense T1; hyperintense T2 – total protein concentration < 10 %
Hyperintense T1; hyperintense T2 –total protein concentration 20–25 %
Hyperintense T1; hypointense T2 – total protein concentration 25–30 %
Hypointense T1; hypointense T2 – total protein concentration > 30 % and inspissated secretions in almost solid form [25].
Notably, inspissated secretions or fungal colonization may produce signal voids on T1w and T2w images, which may result in a signal void and appear identical to normally aerated sinuses [12, 23]. Peripheral, linear enhancement is suggestive of infection, whereas central enhancement is more likely consistent with neoplasm [5, 12]. Additionally, tumor, particularly hypercellular malignant tumors are typically relatively hypointense on T2w images compared to benign sinonasal mucosal disease, allowing the combination of T2 and postcontrast images to help differentiate sinonasal neoplasm from benign mucosal disease (Fig. 4.4a, b).
Ultrasound (US)
Ultrasound (US) has been used in the diagnosis of rhinosinusitis, usually acute sinusitis, primarily in Europe. Its advantages include a lack of radiation, low cost, and wide availability; however, it has poor sensitivity compared with CT. US is not recommended for the evaluation of sinusitis [7, 11].
Normal Anatomic Variants
Although not a direct cause of CRS, many anatomic variations of normal structures in and around the sinuses exist that may predispose to sinus obstruction and inflammation [11, 26]. Knowledge of variant sinus anatomy will also help to avoid complications during surgery [27]. Some of the more common variants will be discussed further below.
OMC/Maxillary Sinus
Septal deviation is one of the most common anatomic variations and is present in 20–79 % of the population, but is often not clinically relevant [26, 28]. However, severe deviation may narrow the middle meatus, impacting the OMC [28] (Fig. 4.5). It may also alter the airflow pattern, which may negatively impact ciliary clearance [11]. Pneumatization of the nasal septum may occur, which is also often not clinically significant, but may narrow the sphenoethmoidal recess [28].
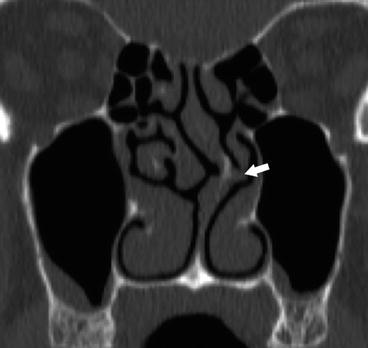
Fig. 4.5
Coronal CT image demonstrating severe leftward nasal septal deviation with spur contacting and deforming the left middle turbinate (arrow), possibly contributing to osteomeatal unit obstruction in this patient with chronic sinusitis
A paradoxical middle turbinate has been shown to be present in approximately 3–26 % of the population [26]. It is believed that this anatomic variant can contribute to the development of sinusitis if particularly large [28, 29]. Concha bullosa, an aerated middle turbinate, is relatively common, is often bilateral, and has been shown to be present in up to 24–55 % of patients [26, 28] (Fig. 4.6). An uncinate bulla, a rare entity with a prevalence of less than 5 %, refers to an extension of air cells into the uncinate process [26, 27, 29]. The ethmoid bulla, the largest and most prominent anterior ethmoid air cell, can be enlarged or extensively pneumatized forming a “giant bulla” [5, 28, 29] (Fig. 4.7). These variants may result in narrowing of the ostiomeatal complex, potentially affecting drainage patterns of the maxillary and frontal sinuses, with a combination of anomalies possibly increasing the pathogenic effect more than any single variant would cause [27]. Pneumatization of the inferior and superior turbinates can also occur, but this is relatively rare with an incidence of <3 % and is usually clinically insignificant because of little impact on drainage patterns [26–28].
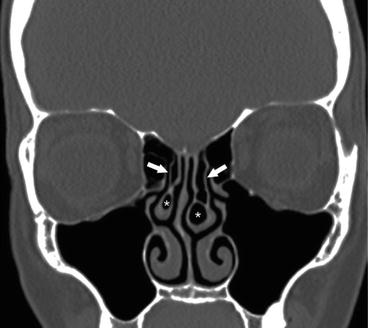
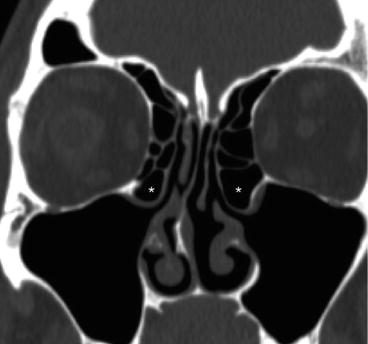
Fig. 4.6
Coronal CT image demonstrating bilateral middle turbinate concha bullosae (*), as well as incidental pneumatization of the vertical insertion of the middle turbinates bilaterally (arrows)
Fig. 4.7
Coronal CT images showing bilateral large ethmoid bullae (*) prolapsing into the maxillary sinus outflow tracts
Haller cells, or infraorbital ethmoid cells, are located along the anterosuperomedial maxillary sinus, just inferior to the orbital floor, and are typically in close proximity to the maxillary sinus ostium (Fig. 4.8). They are estimated to be present in approximately 10–45 % of patients. Bilateral Haller cells are rare. They may contribute to sinonasal inflammatory disease if they result in obstruction of the ethmoidal infundibulum or ostium of the maxillary sinus [5, 26–28].
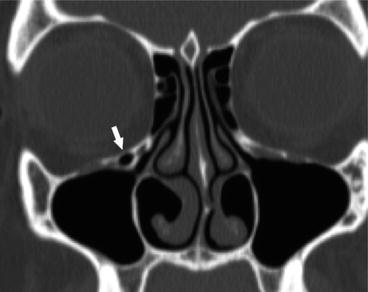
Fig. 4.8
Coronal CT image showing a right non-opacified Haller cell, or infraorbital ethmoid cell, narrowing the maxillary sinus ostium (arrow). Probable opacified tiny Haller cell present on the left as well
Ten to thirty percent of people have an accessory maxillary ostium in the posterior fontanelle (Fig. 4.9a, b). This can cause nasal mucous recirculation and result in recurrent sinusitis. Surgically, if the two ostia are close together, it is important to consider joining the natural and accessory ostia to prevent recirculation [5, 13, 28]. Congenital hypoplasia of the maxillary sinus can occur, which will cause lateralization of the uncinate process. The primary risk of surgery in a case of maxillary hypoplasia is inadvertent penetration of the orbit [5, 28].
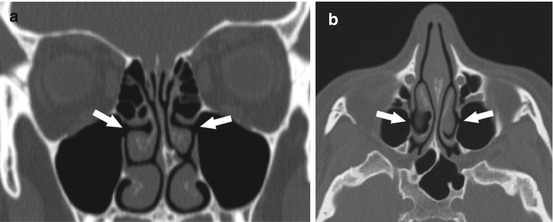
Fig. 4.9
Coronal (a) and axial (b) CT images of bilateral accessory maxillary sinus ostia (arrows), just posterior and inferior to the native maxillary sinus outflow tract
Ethmoid
Anatomic variants in the ethmoid region are usually more important for preoperative planning. Careful evaluation of a sinus CT scan for the presence or absence of mucosal thickening in the ethmoid sinuses, as well as the pattern of ethmoid involvement, is important. The presence of ethmoid roof or lamina papyracea dehiscences should be noted to avoid inadvertent intracranial or orbital entry. The lamina papyracea has been noted to have areas of focal dehiscence in 0.5–10 % of the population [13] (Fig. 4.10a, b). The most common area of dehiscence is at the anterior ethmoid foramen (Fig. 4.11a, b).
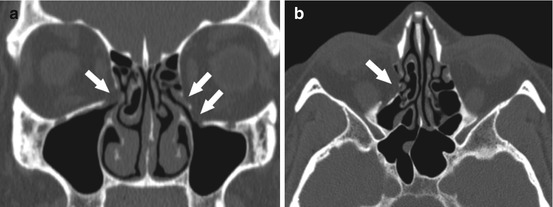
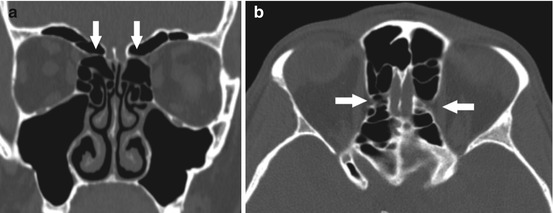
Fig. 4.10
Coronal (a) and axial (b) CT images demonstrating bilateral, right greater than left, inferior lamina papyracea, and orbital floor defects from prior trauma (arrows), with fat herniating through the defect on the right, prolapsing into the maxillary sinus outflow tract
Fig. 4.11
Coronal (a) and axial (b) CT images demonstrating a common appearance of the anterior ethmoid artery canal which is located on a mesentery extending through the ethmoid air cells (arrows). Notice the tapering of the canal as it extends medially, located just medial to the superior oblique muscle, at the level on the coronal view just beyond the globe. Note the lamina papyracea defect on the left associated with the canal
Additionally, variations in the height of the ethmoid roof in comparison to the cribriform plate are also important to consider preoperatively. The Keros classification (Table 4.2) [13, 29] classifies olfactory fossa height according to depth and is often used to assess and quantify the steepness of the ethmoid roof, with a higher likelihood of penetration of the lateral lamella of the lamina cribrosa with increasing height [26]. There may be asymmetry to the height of the ethmoid roof, or the roof may be particularly low, both of which should be noted preoperatively as inadvertent penetration of the skull base may occur if these are not anticipated. The location of the anterior ethmoid arteries should also be noted as to whether they are positioned in the bony skull base or hanging lower in a mesentery, where they may be at risk for injury during surgery when clearing remaining anterior ethmoid cells toward the frontal outflow tract. The anterior ethmoid artery is usually near the insertion of the ethmoid bulla into the skull base. It can be identified on CT as a “pinching” of the medial orbital wall on coronal views just posterior to the globe proper and where the medial rectus and superior oblique muscles are seen in the same cut (Figs. 4.11a, b


Related posts:

Stay updated, free articles. Join our Telegram channel
Full access? Get Clinical Tree
