NANOMATERIALS CHARACTERIZATION
Authors
Simon Allen,1 Peter DeSanto Jr.,2 Christian Gimenez,3 Scott Hanton,2 Todd
McEvoy,2 and John Zielinski2
1Intertek MSG, D125 The Wilton Centre, Wilton, Redcar,
United Kingdom, TS10 4RF
2 Intertek Allentown, 7201 Hamilton Blvd., Allentown, PA, USA 18195
3 Intertek Chalon, Espaces Entreprises, 12 Rue Alfred Kastler, Fragnes, France 71530
ABSTRACT
Nanomaterials are materials that are produced with nanometer dimensions. These materials often exhibit widely different chemical and physical properties than their macro-sized counterparts. Nanomaterials are a rapidly growing field for many product categories, especially cosmetics and personal care. However, with the increased use in these fields, regulatory bodies around the globe have taken an escalated interested in their characterization and safety. To comply with EU and global nanomaterial regulatory controls currently being developed, researchers and manufacturers must have the ability to accurately characterize their products. This chapter provides an overview of analysis techniques available for the characterization of nanomaterials. It should serve as a starting point for those individuals interested in developing fundamental knowledge of nanomaterials based on their elemental, chemical, and physical properties.
b. Liposoluble Organic Soluble Nanomaterials
and Their Delivery Systems
c. Nanomaterial Legislation in Cosmetics
d. Nanomaterials Characterization
1. Particle Size, Distribution, and Shape
1.1 Electron Microscopy Techniques: TEM and SEM
1.2 Probe-based techniques: STM and AFM
1.4 High-resolution particle sedimentation
b. Auger electron spectroscopy (AES)
c. X-ray photo electron spectroscopy (XPS)
1. Dynamic secondary ion mass spectrometry (DSIMS)
2. Static secondary ion mass spectrometry (SSIMS)
11.6.3 Surface Area and Porosity
a. Phase Identification using XRD
b. Phase Composition using XRD
a. X-ray Fluorescence—bulk and trace metals analysis
b. Trace and ultra-trace metals analysis using
ICP-OES and ICP-MS
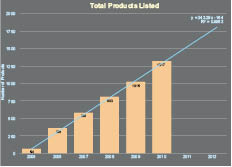
In the cosmetics industry, as in many industries, the potential of nanotechnology to create major technological breakthroughs has clearly attracted considerable attention. It is quite an active innovation field as demonstrated by the number of patents issued on nanotechnology by major cosmetic companies. Nanotechnology is enabling a fast-growing number of consumer products. This is evidenced by more than 1000 products claiming to contain nanomaterials (see Figure I.1a). Figure I.1b displays a breakdown of the nanomaterial application as a function of product category. The data in Figure I.1b show that the market is dominated by healthcare and fitness products, which on their own, represent more than 50% of nanomaterial-containing products placed on the market. In terms of cosmetics, nanomaterials are gaining traction in a variety of applications. For example, nano titanium dioxide is one of the most commonly used nanomaterials in cosmetics. Nano titanium dioxide is typically used in sunscreens exploiting its UV-inhibition properties. Carbon black is often used as an intense colorant, while nanoemulsions and nanosomes are being used to preserve the active ingredients in cosmetics such as anti-oxidants and vitamins.
The types of nanomaterials being used in this area generally can be categorized into two main groups: inorganic particles and organic-based liposoluble particles.


Figure 1.1. Number of consumer products claiming to contain nanomaterials as a function of a) time and b) subcategory.
Inorganic particles are typically used in applications exploiting their enhanced UV-filtering or antibacterial properties. Cosmetic products, such as sunscreens, typically employ mineral-based materials like titanium dioxide or zinc oxide. For these materials, the UV filtering performance directly correlates directly with their diminished particle size. Titanium dioxide and zinc oxide are typically found in the size range far below 100 nm where their UV-inhibiting properties are found to be optimal. Nanoparticles, such as TiO2 and ZnO, provide broad UV-protection and do not cause adverse cutaneous health effects.2
Silver nanoparticles are well known for their antibacterial properties3,4 and are widely used throughout many industries.5 They can be used as a disinfectant and anti-odor substance in textiles. They can also be found in cosmetic products such as deodorants, where claims for up to 24-hour antibacterial protection are often made.
b. Liposoluble Organic Soluble Nanomaterials and Their Delivery Systems
The category of liposoluble organic soluble nanomaterials includes specially designed metastable particle systems with properties to promote efficient and controlled release of active ingredients over time or triggered by different environmental conditions. This type of nanomaterial includes liposomes, nanoemulsions, nanocapsules, and solid lipid nanoparticles.6
Liposomes are concentric bi-layered vesicles with an external dimension below 100 nm. The internal aqueous part is entirely enclosed by a lipid bi-layer composed of phospholipids. These are generally regarded as safe products. Liposomes are used to promote targeted release of their contents, making them useful for cosmetic delivery applications.
Nanoemulsions consist of very fine oil-in-water dispersions of colloidal dimensions. They have droplet diameters smaller than 100 nm. Nanoemulsions are very fragile systems and are in a metastable state. The nanoemulsions are highly valued in skincare due to their positive sensory properties. Because of the extremely small drop size, they are compatible with parentera applications, and transfer through the skin with rapid penetration and hydrating power of the stratum corneum.
Nanocapsules are submicroscopic particles that are made of a polymeric capsule enclosing an aqueous or oily core. Encapsulation technologies were originally developed for drug-delivery applications but have been extended to cosmetic skincare applications. Different core/shell combinations are required based on the Active Pharmaceutical Agent (API) being administered and the location of where the drug is to be administered in the body. The same structure/property relationships exist in cosmetics applications. With regard to skincare, nanocapsules have been used to deliver UV-absorbing molecules to the surface of the skin, while also preventing percutaneous absorption.
Solid lipid nanoparticles are oily droplets of lipids that are solid at body temperature and stabilized by surfactants. They can protect the encapsulated ingredients from degradation and can be used for the controlled delivery of cosmetic agents over a prolonged period of time.
c. Nanomaterial Legislation in Cosmetics
Recognizing the increasing number of cosmetic and personal care products containing nanomaterials, European authorities have approved the amended recast of the EU Cosmetics Directive, introducing for the first time the mention of “nanomaterials” in an EU legislation. This includes the first ruled definition of a nanomaterial as “an insoluble or bio-persistent and intentionally manufactured material with one or more external dimensions, or an internal structure, on the scale from 1 to 100 nm.7 Only cosmetic products for which a legal or natural person is designated within the community as the ‘responsible person’ shall be placed on the market” (Art. 4, p. 4). The Responsible Person is responsible for ensuring that all the obligations related to product conformity have been carried out prior to introducing the product onto the European Market and more specifically in practice the responsible person should submit the following information to the European competent authorities:
- • The presence of substances in the form of nanomaterials
- • Identification including the chemical name (IUPAC) and other descriptors
- • The reasonably foreseeable exposure conditions
- • Labeling obligation: ingredients present in the form of nanomaterials shall be clearly indicated with “nano” in brackets
With the scrutiny of nanomaterials set to continue, we can expect changes to the EU and global regulatory environment as policymakers at all levels attempt to keep pace with understanding the chemical and physical characteristics of nanomaterials and how they impact both the environment and humans.
d. Nanomaterials Characterization
To demonstrate regulatory compliance and help produce and implement accurate implementation of EU and global definitions, utilization of the appropriate analytical instrumentation and methods is critical. Researchers and manufacturers must have the tools available to comprehensively understand their products as individual ingredients as well as when formulated into final cosmetics. This chapter provides an overview of the different analytical techniques available for the characterization of nanomaterials. It should noted here that we have focused on the characterization of raw materials rather than finished products. The full characterization of a finished product, like a cosmetic cream, will be much more complex.
Several regulatory and technical challenges exist for characterizing finished products. The first is to adequately define what a nanomaterial is in a multi-component system. For example, are aggregates of nanoparticles with length scales > 100 nm appropriately classified as nanomaterials even though the individual particles in the aggregates may be on the scale of 10 nm? The second is to determine if toxicological and other properties are related to the size of aggregates or individual particles in the aggregates. More extensive testing is required to fully understand the relationships between particle size and properties in such systems. To that end, determining whether such a product is a nanomaterial, or indeed contains nanomaterials, will require continued development and refinement of the analytical methodologies currently available.
1. Particle Size, Distribution, and Shape
The ability to fully characterize particle size, and potentially shape, distributions is fundamental in the development, use, and regulation of nanoparticles and nanomaterials.
Particle size lies at the heart of the various international definitions of nanomaterials and particles. For example, the European Commission (EC) defines a nanomaterial, for regulatory purposes, as “a natural, incidental or manufactured material containing particles in an unbound state or as an aggregate or as an agglomerate and where for 50% of the particles in the number size distribution, one or more external dimensions is in the size range of 1 nm to 100 nm.”7 This form of definition itself raises many challenges for the analyst. A starting point is that it is necessary to be able to reproducibly and accurately measure the particle sizes of “raw materials”—including particulates, powders, clays, and fibrils. However, it is also a requirement that these particle size distributions can be characterized once the raw materials are incorporated into a final product form, where they may only comprise a fraction of the total product mass. It is certainly not sufficient to assume that the particle sizes in the product are equal to those in the starting materials—as processing can result in either fragmentation or agglomeration of the particulates (or both!). In many cases this is not yet readily achievable, and it has been recognized by a number of regulatory bodies that further method development is required before the measurements can be carried out on a routine basis.
Linsinger recently produced a very comprehensive summary of the different analytical techniques available for the characterization of nanoparticles, and their relative strengths and weaknesses.8 It must be noted that no one technique will provide a full description of the particle size and shape distributions, and chemical composition. Below we outline several approaches for the determination of particle size, shape, and distribution.
1.1 Electron Microscopy Techniques: TEM and SEM
Microscopy techniques are probably the only way to characterize such particles directly. The other methods involve the measurement of some property (scattering power, surface area, etc.) of the nanomaterial and the application of some generally imperfect algorithm to translate the variations in the measured property into a size distribution. The algorithms will inevitably involve simplifying assumptions, such as that the particles are all spherical, or of uniform density, and so a number-based distribution derived in this way will always be imperfect.
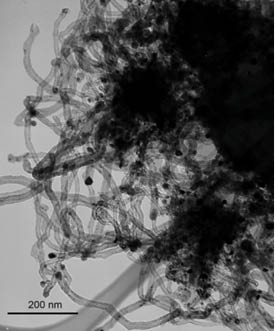
It is possible to visualize and explore shape and morphology directly with scanning electron microscopy (SEM) and transmission electron microscopy (TEM) techniques.9,10 Both techniques can look at features at or below the 1 nm scale. As their names suggest, SEM essentially produces an image of a surface, while for the TEM the electron beam has to pass through the sample—requiring ultrathin specimens. Figure 1.1.c shows a TEM image of carbon nanotubes, illustrating clearly that visualization of a structure can often provide the most straightforward approach. The TEM image clearly demonstrates that the shape, internal structure, length, and width can easily be observed and subsequently measured. None of the techniques described below would provide an accurate description of the sizes of the tubes illustrated here.

Figure 1.1.c Transmission electron microscope image of carbon nanotubes. The scale bar in the lower left is 200 nm.
With most microscopy techniques, specimen preparation is critical to the outcome of the experiments. The manner in which a sample is prepared often is the most difficult part of the experiment and tends to be a skill set in its own right. Therefore, having the appropriate knowledge of different preparation techniques and being able to perform these techniques proficiently is a key part of examining nanomaterials with electron microscopes.
In principle, the use of computer-based image analysis techniques can be coupled to electron microscopy to generate quantitative size and shape distributions. In practice, the methods are limited—particularly in the generation of statistically significant data. In general, these techniques will sample very small numbers of particles, and significant operator intervention is often required to use image analysis techniques to generate dimensional information. These factors, coupled with the relatively high cost of the instrumentation, also mean that electron microscopy is an expensive approach to materials characterization, if the equipment must be purchased and maintained by the research organization. Outsourcing is one way to help manage the costs to obtain high-end analytical support.
SEM or TEM coupled with energy-dispersive X-ray Spectroscopy (EDS) allows elemental information to be gained for individual particles. Variations in chemical composition may also be studied or mapped, even within individual particles. Again, it is important to note that almost all other techniques will analyze the ensemble properties rather than those of individual particles.
1.2 Probe-based techniques: STM and AFM
The capability to characterize localized properties such as size, morphology, orientation, and roughness in nanoscale materials has been greatly enhanced by the development of the scanning probe microscopies11 [(scanning tunneling microscopy (STM) and atomic force microscopy (AFM)]. A great deal of information regarding these properties can be obtained from STM experiments; however, the use of STM necessitates an electronically conducting sample. This requirement limits the number of materials that can be studied by STM. AFM, on the other hand, can be used to study the morphological characteristics of both conductors and insulators. In fact, variants of standard AFM, including electrostatic force microscopy (EFM),12 scanning surface potential microscopy (SSPM)13 and conductive probe atomic force microscopy (CP-AFM)14,15 have proven useful for the study of the nanoscale electrical properties of various conducting and insulating materials including metal-insulator composites,16 semiconductors,17 and nanomaterials.18
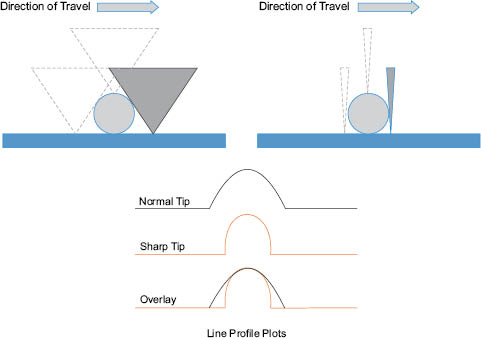
For both STM and AFM,11 a sharp probe is rastered across the surface of a material using a piezo-electric tube scanner. Although the feedback mechanisms are different, the resulting images provide information on morphology, composition, and a variety of surface texture parameters. In either of these probe-based analysis techniques, there are several key experimental aspects that need to be carefully controlled, or at least understood, to properly characterize nanomaterials.19 Both lateral and vertical calibration of the instruments needs to be performed with well-characterized reference materials so that accurate measurements can be made. A variety of instrument-specific grids made from either metals or metal oxide substrates are commercially available from numerous probe suppliers. These grids are also available with VLSI certification and NIST traceability. One issue that confounds accurate size measurements by probe-based techniques is the influence of the tip shape and size. When measuring materials on the same order of the tip radius, severe tip-convolution effects can be encountered and this effect tends to be more prominent with AFM than STM. Numerous probe manufacturers have been developing high-aspect ratio probes with sharp tip radii for use in AFM measurements. A simplified drawing of the probe convolution problem is shown in Figure 1.2. The shape of a particle is more accurately defined with the sharper probe. However, it should be noted that with either case, the particle height remains the same.

Figure 1.2. Pictorial representation of how tip shape effects lateral size estimates for a nanoparticle. The path of travel for a normal probe and sharp probe are illustrated in the upper left and upper right, respectively. The lower portion shows stylized profile plots for the normal and sharp tips.
To circumvent the tip convolution issue, several research groups and software companies have developed tip deconvolution algorithms that enable the tip shape and size to be removed from scanning probe images in order to collect more accurate size measurements.20, 21, 22 However, there is much debate in the literature as to which algorithms are most appropriate. An alternative to these algorithms is to simply use the height measurement, rather than the lateral measurement to determine particle diameter. Estimates of particle diameter using the height measurement are fairly reliable, assuming the particles act as hard objects and are not pressed into the substrate, and that the particles themselves are not damaged under inappropriate imaging conditions.
A significant advantage of AFM over many other techniques is that a nanomaterial can be imaged in either air or fluid environments. This allows for development of an improved understanding of how the individual particles, fibers, or tubes behave in various media. Of course, as with all probe-based techniques, the analysis of these materials requires that they are adhered to a substrate when imaged in either air or fluid environments. The substrates in these experiments can be any number of materials, ranging from rigid glass or metals to biological materials such as skin or hair.
Dynamic light scattering (DLS) methods are commonly used on insoluble materials.23 There are a number of different measurement technologies, but they all involve the measurement of the angular distribution of light scattered by the particles in solution (or in air). “Standard” DLS methods will measure down to around 40 nm, but cross-correlation methods can be used on particles down to a few nm in size. The algorithms used to convert scattering distributions to particle size generally assume that the particles are spherical, and so the methods should be used with caution on materials such as clays or nanotubes that differ markedly from the assumed geometry. Light-scattering methods are also rather poor in resolving components of multi-modal distributions.
1.4 High-resolution particle sedimentation
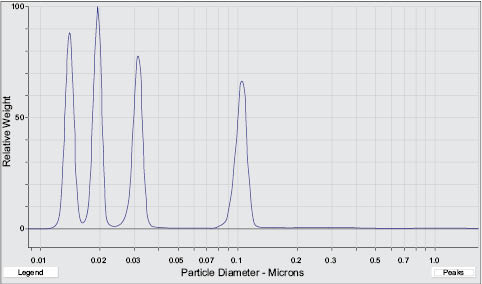
A method better suited to substances with multi-modal distributions is that of centrifugal liquid sedimentation or disc-centrifuge.24 Essentially this technique fractionates a poly-dispersed distribution by time to sedimentation, producing improved resolution of different particle sizes. However, once again the conversion of the sedimentation time distributions into a true number-based particle size distribution is not straightforward, and there are also practical difficulties with instrumental dynamic range in acquiring an accurate distribution covering a very wide range of particle sizes. Nevertheless, disc-centrifuge methods can give an accurate picture of the multi-modal particulate materials down to a few nm in size. Figure 1.3 demonstrates the ability to separate a mixture of particles that exhibit average particle sizes of approximately 15 nm, 20 nm, 32 nm, and 100 nm. By comparison, the analysis of this same solution by dynamic light scattering would yield less resolution around the smaller particle sizes causing misinterpretation of the true particle size distributions.

Figure 1.3. Example of the resolution obtained for particle sizing of a multi-modal particle mixture using high resolution particle sedimentation.
In the traditional sense, the study of the surface chemistry of a material may involve the measurement of the degree of hydrophilicity or hydrophobicity, and interfacial forces. Due to experimental constraints, these properties are more easily performed on macroscale systems rather than ones that exhibit nanoscale dimensions, thus complicating the ability for researchers to understand these properties. However, measurements of the surface elemental and chemical composition can be used to gain insight into these properties. Here, the term “surface chemistry” relates to the analysis of elemental and chemical information at depths typically ranging from 2 to 10 nm. Obviously, as the dimensions of the nanomaterial become smaller, the definition of the surface becomes blurred, making these measurements more challenging.
A key aspect of how nanomaterials interact with their host matrices is determined by the chemical and physical properties of their surfaces. In this regard, both Auger electron spectroscopy (AES) and X-ray photoelectron spectroscopy (XPS) are well suited for obtaining information such as surface elemental composition.25
Stay updated, free articles. Join our Telegram channel

Full access? Get Clinical Tree


