QUANTIFICATION OF SKIN APPEARANCE
Author
Roger L. McMullen, Ph.D.
Principal Scientist
Materials Science Department
Ashland, Inc.
Bridgewater, NJ 08807
Adjunct Professor
School of Natural Sciences
Fairleigh Dickinson University
Teaneck, NJ 07666
ABSTRACT
Imaging technologies have become increasingly important in the evaluation of cosmetic ingredients and their effects on skin. This need has been greatly fueled by requirements for the technical evaluation of the effects of new ingredients and formulations intended for use in anti-aging, skin whitening, pore size reduction, and anti-acne products. This chapter provides an in-depth focus of imaging technologies that are utilized to evaluate the appearance of skin from the outside as well as to look inside the skin to assess its overall health state. In addition to obtaining a vast description of instrumentation and techniques used for such applications, the reader will also gain insight into the fundamental physical principles underlying these technologies.
In the last two decades, a number of imaging modalities have been developed to provide quantitative assessment of the skin’s topographical structure. Commercial instrumentation based on fringe projection techniques is now available and provides us with a close-up three-dimensional view of the skin’s surface, which is especially useful for quantifying furrows and pores. Other skin imaging technologies have also advanced by leaps and bounds, especially in the area of polarized light and fluorescence photography, which are commonly used in conjunction with image analysis techniques. In fact, it is now quite common for laboratories to carry out multi-spectral multi-modal imaging, which combines polarized light, fluorescence, and other modes of photography under one umbrella.
Novel thermal imaging technologies allow us to gather temperature distribution maps of skin, providing us with anatomical differentiation as well as the ability to focus on specific areas of interest that have undergone treatment with active cosmetic ingredients. Below the surface of skin, great strides have also been made in the evaluation of the skin’s internal structure. Examples of techniques useful in this regard include, but are not limited to, reflectance confocal microscopy and ultrasonography. There have been many advances in these imaging techniques over the past 10–15 years that have been coupled with a flurry of in vivo studies. In fact, many of these technologies are used to carry out important evaluation of skin lesions, both benign and malignant, as well as other important phenomena that occur in skin.
In this chapter we also discuss high-resolution microscopy methods, which in many respects have started to reach their maturity and offer many insights into phenomena that occur in skin. Equally important, image-processing and analysis techniques that are associated with all of these imaging technologies provide us with quantitative descriptions of skin-related measurements. This is especially true for histological and immunofluorescent staining techniques, which are exceptionally useful to monitor the effects of skin care active ingredients. In most cases, treatment of skin with active ingredients leads to the upregulation or downregulation of specific proteins and other biomolecules as measured in cell culture systems in vitro and in the various morphological components of skin as monitored in vivo or ex vivo. Traditionally, histological and immunofluorescent images were qualitatively assessed by a researcher or pathologist. Thanks to advances in image analysis software, such evaluations can be achieved quantitatively. The overall goal of this chapter is to touch upon many important facets of this technology and provide the reader with a general overview and the current state-of-the-art.
11.2.1 Skin Surface Imaging and Analysis
a. Polarized Light Photography
b. Imaging Techniques with Skin Replicas
c. Fringe Projection Methods to Measure Skin Topography
f. Ultraviolet (UV) Reflectance Photography
g. Fluorescence Reflectance Photography
h. Multi-Spectral Multi-Modal Facial Imaging
i. Photographic Analysis of Lips
j. Hyperpigmentation Measurements of Skin
11.2.2 In Vivo Imaging of Internal Features of Skin
a. Reflectance Confocal Microscopy
11.2.3 High-Resolution Microscopic Techniques for Imaging Skin
a. Reflected Light Microscopy (Epi-illumination)
b. Scanning Electron Microscopy (SEM)
c. Transmission Electron Microscopy (TEM)
d. Atomic Force Microscopy (AFM)
a. Measuring Pigmentation of Histological Skin Sections
b. Immunofluorescence Staining Quantification
in Fibroblast Cell Cultures
c. Image Analysis of Triple-Stained Normal
Human Keratinocytes (NHKs)
d. Measurement of Collagen IV Expression at the
Dermal-Epidermal Junction
11.2.1 SKIN SURFACE IMAGING AND ANALYSIS
Skin topography is an extremely important component of the consumer’s sensorial experience, mostly perceived by visual observation and touch. Since the stratum corneum is the outermost layer of skin, it is the first part of the integument seen by the observer. The stratum corneum is comprised of corneocytes, which exfoliate from the skin. The exfoliation pattern depends on the overall health state of the skin. For example, in dry, scaly skin, corneocytes tend to exfoliate in large clusters. This is known as scaling and is frequent in dry skin as well as many common dermatological diseases, such as psoriasis. On the other hand, in smooth, moisturized skin corneocytes will shed off in much smaller clusters, ideally as individual cells. Skin ashing is a term frequently used to describe skin characterized as dry with decreased luster properties.1 The skin’s microrelief pattern also contributes significantly to its topography. Fine grooves (furrows) intersect with each other, forming many types of shapes including squares, rectangles, triangles, rhomboids, and trapezoids that contribute to the skin’s glyphic patterns. Glyphic patterns provide the skin with the necessary flexibility to accommodate various ranges of motion, especially in the joint regions. Glyphic patterns should be distinguished from wrinkles, which are genetically determined and develop during adulthood as a result of dermal matrix deterioriation.2 The formation of wrinkles can be accelerated by various environmental factors including exposure to solar radiation. In addition to the stratum corneum and its components, there are a number of appendages (e.g., hair and pores) in skin that also contribute to its three-dimensional landscape.
In this section of the chapter, we describe many of the methods used to measure skin topography. These include polarized light photography, skin replica methods, and fringe projection techniques. In addition, we examine various factors associated with quantification of pore appearance, which contribute greatly to skin topography, especially in the facial region. Lip health is another area of great importance to the consumer and therefore of great interest to cosmetic scientists attempting to improve its appearance. For this reason, we discuss several techniques to measure not only lip properties, but also the influence of both cosmetic and active ingredient treatments. A detailed discussion of lip structure can be found elsewhere in this book in the major section on substrates.
Other imaging techniques have also been used to a great extent to characterize various features of skin. For example, ultraviolet reflectance photography is used to better visualize areas of hyper- and hypopigmentation in skin. Fluorescence reflectance microscopy is also capable of generating pertinent information about internal structures of skin, such as collagen, horn, porphyrins (due to acne vulgaris), etc. The emergence of these techniques over the last two decades has led to the development of commercially available instruments to conduct multi-spectral multi-modal facial imaging.
a. Polarized light photography
Surface and subsurface features of the skin can be accentuated with polarized light photography.3,4 Important surface features measured by polarization photography consist of wrinkles, furrows, and pores. Subsurface features, on the other hand, include erythema, vascular lesions (e.g., portwine stains, rosacea, etc.), and pigmented lesions.5 Polarized light photography has been employed in clinical dermatology and for the evaluation of personal care products for more than two decades.
Before delving into the particularities of polarization photography, there are a few principles of optics that should be considered. There are two types of light reflection: specular and diffuse reflection. Specular reflection is associated with glare and has a shiny appearance, which in the case of skin results from direct reflection from the outermost surface of the stratum corneum. The angle of incidence equals the angle of reflection in specular reflection, similar to the phenomenon that occurs when light reflects from a smooth surface. A familiar example of this in nature is when one observes a lake with a mountain in the background with the mountain’s reflection projected on the smooth lake’s surface. In skin, only about 4–7% of the incident light on the surface of skin undergoes specular reflection.6
Diffuse reflection, on the other hand, is light scattered at various angles due to imperfections at the surface where the angle of reflection is not equivalent to the angle of incidence. Light also penetrates into the skin where it may be absorbed by melanin and other chromophores, or it interacts with other structures such as collagen fibers causing the light to scatter (changing its orientation of polarization) prior to reflecting back outside of the skin. This latter process is known as backscattering and accounts for approximately 93–96% of incident light that interacts with skin.6
During polarization photography, the diffuse and specular components can be separated using linear polarization filters. Normally, one filter is placed in front of the light source and the other is mounted on the lens. In our laboratory, we typically use polarization paper that can be cut to size in order to cover the light source. When the polarizers are aligned parallel to each other we observe specular reflection, similar to the image of volar forearm skin shown in Figure 1a. Notice the accentuation of the surface features and crosshatched nature of furrows by maintaining the same degree of polarization of light that illuminates the subject and is read by the camera sensor.
In contrast, orienting the polarizing filters perpendicular to one another allows us to view diffuse scattering (see Figure 1b). Images obtained of skin in this manner will contain information resulting from the backscattering phenomenon, especially that caused by vascularization. These images were obtained from a relatively young individual (35 years old) with Fiztpatrick Type II skin, little history of photo-damage, and from a region of the body (volar forearm) that is generally protected from UV rays.
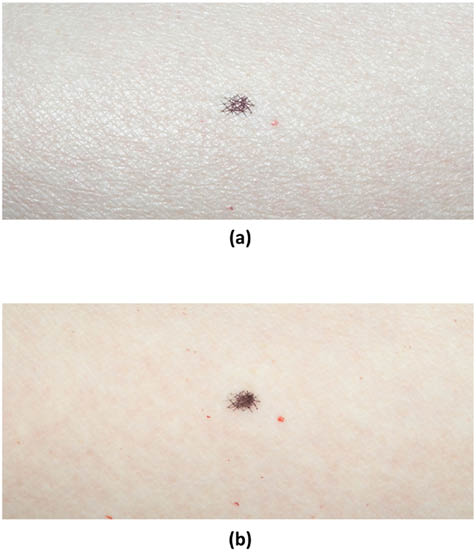
Figure 1: Photographic images of the volar forearm of a subject with Fitzpatrick Type II skin; age 35. Polarizers were placed in front of the illumination light source and the lens. (a) Image obtained with polarizers oriented parallel to each other. (b) Image obtained with polarizers oriented perpendicular to each other (cross polarizers). The small dark spot in the middle of the field of view is a marking reference point.
In addition to qualitative visual observation of the images, typically one would quantify various features in the image. This is especially true in the case of the image obtained with parallel polarizers. Normally, one is interested in the density and directionality of the furrows in a given image. Usually, computer-generated algorithms or image-processing and analysis software are utilized to isolate the furrows from the original image. In Figure 2, several typical steps are shown using commercially available software (Image Pro Plus and Adobe Photoshop) in order to isolate the furrows so that further measurements can be made.
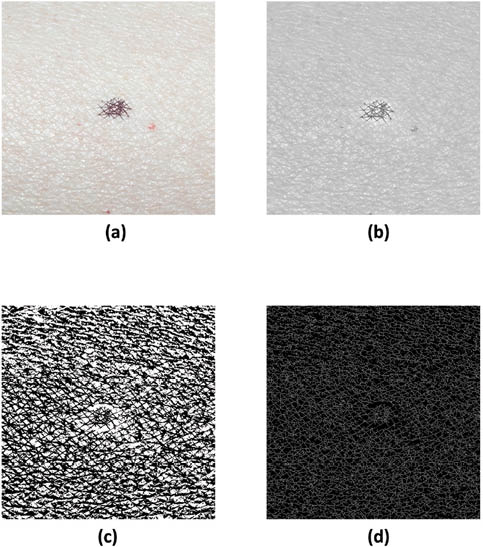
Figure 2: (a) Image from Figure 1a subjected to a series of image-processing steps to isolate furrows including: (b) flattening and conversion to grayscale, (c) sharpening and contrast adjustment, and (d) inversion and skeletonization.
The mounting of illuminating lights is a key factor in obtaining properly lit images. The very first systems used for this purpose consisted of a flash unit fixed in the hot shoe mount of the camera. Later, more sophisticated flash housing units were developed, placing two light sources on each side of a macro lens. The camera and lighting system shown in Figure 3 is a typical macrophotography flash system manufactured by Nikon. Similar systems are also available through other camera manufacturers, such as Canon. In these systems, polarization paper can be cut-to-size and inserted underneath the front cover of the speed light. A linear polarization filter can also be mounted directly on the lens. In more recent years, a multipurpose system known as the Visia Complexion Analysis (VISIA-CR, Canfield Scientific, Fairfield, NJ) was developed allowing researchers to conduct visible light, polarized light, UV reflectance, and fluorescence reflectance photography (www.canfieldsci.com). These other modes of photographic investigation and the multi-spectral multi-modal facial imaging system are described in the sections below.
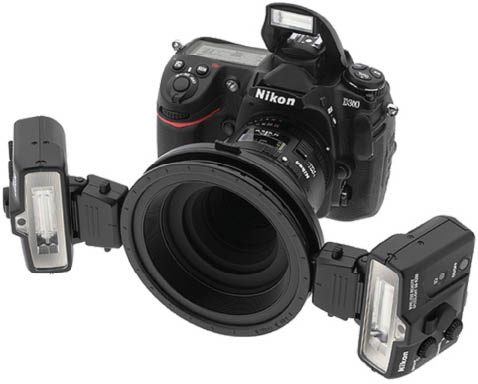
Figure 3: Photograph of a Nikon DLSR (Model D300), which contains the Nikon R1 Wireless Close-Up Macro Speedlight Flash System.
b. Imaging Techniques with Skin Replicas
Skin replica techniques are among the oldest of the trade.7 They are relatively quick procedures that are easy to carry out, and they provide very useful information about the surface structure of the skin. To a large extent, innovative instruments capable of noninvasive (noncontact) three-dimensional imaging have captured the spotlight and in many cases have become the preferred method of topographical analysis of skin. However, these instruments are often very costly and not available to most laboratories. Thus, researchers still find utility for replicas in the analysis of skin topography.8,9 Skin replicas can capture topographic features such as deep wrinkles, furrows, pores, and, even, droplets of sweat beads.10,11 Utilizing digital imaging techniques, replicas may be imaged and, subsequently, analyzed with image analysis software.
The most common skin replica experiments are carried out using a dental impression material made of vinyl polysiloxane (Silflo, Flexico Developments Ltd., Potters Bar, UK) in combination with a solvent thinner and catalyst. These materials are available through CuDerm Corporation (Dallas, TX; www.cuderm.com) and are used in conjunction with a replica locator. Silflo is mixed with catalyst, usually 1 mL of the impression material with 1 drop of catalyst, and then poured into a replica locator, which is placed at the site of interest on the skin. The ensuing polymerization reaction results in a paste that hardens with time.
Historically, replicas were analyzed by taking a photograph with a film-based SLR camera or by conducting profilometry. It should be noted that the obtained replica is a negative impression of the skin surface. However, in many cases researchers take an additional step and create a positive impression of the mold. In the case of contact or laser profilometry, one can generate a three-dimensional image of the surface. Contact profilometry generates a topographic map of the surface by rastering a stylus on the positive impression.12,13 Laser profilometry, on the other hand, operates on the principle of laser triangulation, does not require contact with the sample, and generates a three-dimensional image of the replica by performing vertical (z-axis) measurements of the height while scanning in the lateral directions (x- and y-axes).14 Depending on the desired level of magnification, scanning electron microscopy could also be used to capture surface details of replicas.15,16 Nowadays, most groups perform the analysis on the negative impression rather than going through the additional step of generating a positive impression. In part, this is due to advances in image-processing techniques, which allow for the inversion of the negative impression image.
With the most common analysis, a digital image of the replica may be obtained by mounting a digital SLR camera (containing a macro lens) above the sample. A typical setup would include a macro copy stand that includes a camera mount and, in some cases, illumination lights (see Figure 4). If illumination lights are not provided with the system a remote flash system can be used with the camera (Nikon and Canon provide macro flash units that serve this purpose fine). Fiber optic illuminators are also often employed. Regardless of the light source, the replica must be illuminated with oblique light at an optimal grazing angle of 25°. Another alternative for imaging the replica is to use a flatbed scanner. This technology allows high resolutions to be obtained and provides greater depth of field imaging than that available with a standard macro lens used in combination with a DSLR camera.
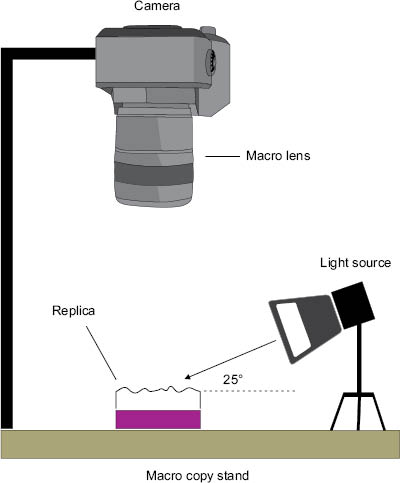
Figure 4: Illustration of a macro copy stand that includes a camera, macro lens, and illumination source to provide oblique lighting of a skin replica.
Skin replicas are usually analyzed to determine the degree of roughness and density of wrinkling of the skin. It has been most successfully used to measure photo-damaged skin and premature aging of skin subjected to tobacco smoke.9,10 A typical replica analysis would be carried out on the perioribital region adjacent to the eye. From the generated image one may perform optical profilometry in which the light intensity of the furrows is measured. Important parameters include the average depth of the furrow, variance between the altitude of the highest peak and lowest peak of the furrows, and the density of furrows.9
Skin replica analysis can also be extended to other phenomena in skin, such as monitoring sudoriferous behavior. As an example, Figure 5 contains a skin replica image (obtained with a flatbed scanner) of the volar forearm of an individual exposed to a high-temperature environment (45˚C) for 30 min to induce sweating. Small protruding beads of sweat on the surface of the skin result in dark areas in the image, which can be isolated and quantified using several image-processing and analysis techniques. In this way, the number of active sweat glands per given area can be quantified.
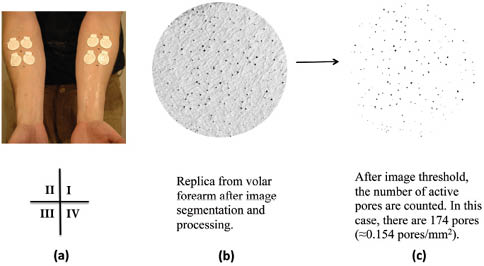
Figure 5: (a) Photograph of the volar forearms of a subject containing replica rings arranged in a four-quadrant layout. (b) Digital image of a cast from the volar forearm region along with (c) its image-processed counterpart containing isolated sweat profusions on a white background (counted). Reprinted from McMullen et al. with permission from the Society of Cosmetic Chemists, © 2013.17
c. Fringe Projection Methods to Measure Skin Topography
In addition to replica methods and photography, skin topography is also frequently measured using fringe projection methods. As shown in Figure 6, a digital projector is employed to project a phase-shifting fringe pattern on an object of interest. Meanwhile, an image of the fringe pattern on the three-dimensional object is obtained with a camera. Due to surface topography, the fringe pattern is deformed and can be analyzed by a computer algorithm allowing for the generation of a three-dimensional image. For evaluating the surface features of skin the two most popular commercially available instruments are the PRIMOS® (GFMesstechnik GmbH, Teltow, Germany) and DermaTOP® (EOTECH SA, Marcoussis, France) systems.19 The principal difference between the two instruments is the manner in which the fringe patterns are produced. In the PRIMOS® system, fringe patterns are generated with micro-mirrors while the DermaTOP® system utilizes a template to generate the shadows.18,20 Optimally, the DermaTOP® FOV HE-25 system performs a measurement on a 20 × 15 mm2 field of view with 2 μm vertical resolution, 15 μm lateral resolution, and 1 s acquisition time. On the other hand, the PRIMOS® premium system gathers data from a 24 × 14 mm2 field of view with 2.4 μm vertical resolution, 24 μm lateral resolution, and 70 ms acquisition time.21 The reader should note that these specifications are only for two specific models. It should be mentioned that each company has a series of instruments with various specifications.
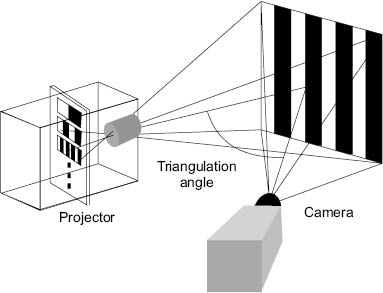
Figure 6: Schematic of a fringe projection (interferometry) profilometer. Reproduced from Lagarde et al. with permission by John Wiley & Sons, © 2002.18
Fringe projection techniques are used to measure skin topography directly in vivo and also in vitro using skin replicas. Skin topography, also referred to as skin relief or texture, is an important feature of the skin that reveals its state of health. Most studies focus on measuring skin roughness and other topographical features, such as wrinkles and furrows.22 In addition, these techniques may be also utilized to monitor the skin’s health state as associated with lesion malignancy, laser remodeling, radiation treatment, treatment with cosmetic products, and hydration state of the skin.21 For illustration, Figure 7 demonstrates the use of the DermaTOP® system to monitor the difference between the temple skin (periorbital region obtained with a replica technique) of two subjects, one 73 years old and the other 23 years old. The deep furrow in the middle of the three-dimensional plot can clearly be discerned in the elderly subject (septuagenarian). On the other hand, in the vicenarian (23-year-old) pores are the dominant feature as there are no discernible deep wrinkles or furrows.
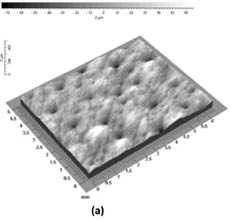
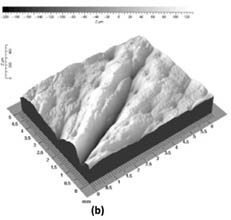
Figure 7: Three-dimensional image of the temple (periorbital region) of (a) a 23-year-old and (b) 73-year-old subject. Reprinted from Lagarde et al. with permission from John Wiley & Sons, © 2005.22
For further illustration, Figure 8 contains three-dimensional representations (in two-dimensions) of the furrow distribution in the volar forearm region of both subjects (also of a skin replica), along with image analysis markings to quantify the anisotropy of the furrows (i.e., the quantity of furrows oriented in different directions). In the vicenarian subject, it is clear that the furrows form a crosshatched structure where the level of isotropy is high while in the septuagenarian subject the orientation of the furrows is more anisotropic. Findings from these studies can be summarized as follows. Roughness, peak-trough amplitude, and anisotropy of the furrows decrease with age. The density of the furrows, on the other hand, decreases with age.22 Other important skin surface parameters that can be measured with fringe projection devices include the maximum roughness (Rm), the mean roughness (Ra), mean depth of roughness (Rz), and waviness (Wt).23 Overall, these techniques are being employed by many different laboratories around the world as newer, more portable devices are becoming available.
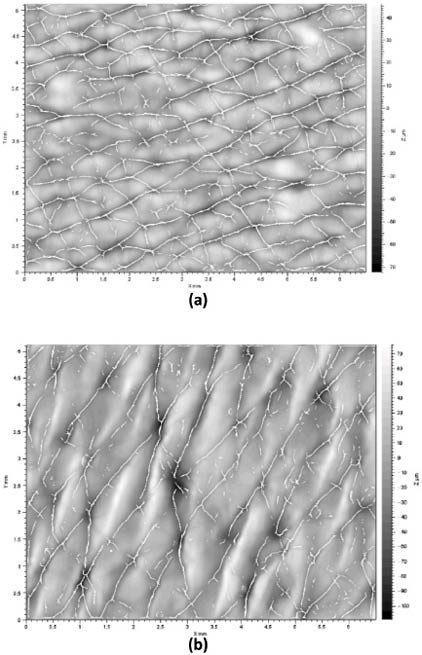
Figure 8: Two-dimension representation of a three-dimensional image of the volar forearm of (a) a 23-year-old and (b) 73-year-old subject. Furrow markings generated by an image analysis package are shown. Reprinted from Lagarde et al. with permission from John Wiley & Sons, © 2005.22
Over the last decade, increasing attention has been given to the topic of skin pores—also often referred to as facial pores. In this case, the term “pore” evolved from the lay population to describe an opening in the skin associated with a pilosebaceous unit, which consists of the sebaceous gland and hair follicle. These “pores” are clearly evident to the human eye and are especially visible in certain anatomical regions of the body, such as the face, where they often present themselves in areas adjacent to the nasal region. Such pores are generally associated with excessive sebum production.24 In most cultures, the visible appearance of these pores is undesirable for many individuals, and for this reason, there have been considerable efforts in recent years by the personal care industry to develop products that reduce pore size.
Not to be confused with pilosebaceous pores, sudoriferous pores also open up at the surface of the skin. Eccrine glands secrete a clear isotonic solution of sweat on the skin’s surface to provide an evaporative cooling apparatus for the body. The gland is connected to the surface of the skin by means of the eccrine duct—a long tubular structure. These pores are located on the top of furrow ridges in skin and are not visible by the naked eye. On the other hand, facial pores associated with pilosebaceous units are generally much larger. They can be classified into three different types: visible skin pores (0.1–0.6 mm2), enlarged skin pores (0.3–0.6 mm2), and blackhead embedded pores (tonality is lower than the rest of the skin surface).25 It should be noted, however, that there is not a universal agreement on the classification of pores. There are also such classifications as invisible pores (< 0.04 mm2), visible pores (0.04–0.07 mm2), and enlarged pores (> 0.07 mm2).26
Surprisingly, there has not been a great deal of research investigating the nature of facial pores until recent years. The origin and formation of pores is dependent upon a variety of factors including hereditary factors, seborrhea, acne, comedogenic xenobiotics, aging, and chronic UV light exposure.27
Recent studies suggest that pore size is greatly influenced by gender and sebaceous activity—males tend to have greater quantities of pores, possibly due to greater androgen activity.25 In females there is no correlation linking age with pore size or quantity. On the other hand, while acne-prone skin tends to contain greater quantities of pores, there appears to be no correlation between severities of acne and pores.25 From a different perspective, treatments intended to reduce the size of facial pores are primarily concentrated in the dermatological arena and include topical retinoid therapy, chemical peeling, and laser therapy.
Quantitative Assessment of Pore Size and Quantity
Assessment of pore size and quantity may be achieved utilizing several different imaging techniques. The most basic of these include visual grading, macrophotography, and evaluation of silicone replicas. Visual grading may be completed in the presence of a panelist or utilizing a photograph. In most cases, it is imperative to correlate visual grading to one of our quantitative techniques. Macrophotography is a rapid, noninvasive strategy for quantifying pores; however, it is very difficult to obtain reproducible results due to challenges with illumination conditions. Nevertheless, utilizing a carefully controlled facial positioning and lighting system, one may accurately count the number of pores and their size. These can be estimated from the area measurements of two-dimensional photographs. Figure 9 contains a photograph obtained with an optical image analyzer called Facial Stage (Facial Stage DM3, Moritex Saitama, Japan). The original photograph and its image-processed counterpart are shown in the figure. The yellow circles in Figure 9c, the enlarged processed image, are representative of facial pores.
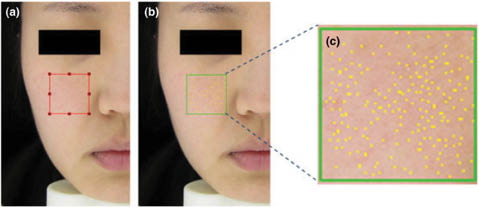
Figure 9: Image of visible skin pores obtained with the Facial Stage optical image analyzer illustrating (a) the origal image, (b) processed image, and (c) enlarged region of the selection in (b). Reprinted from Kim et al. with permission of John Wiley & Sons, © 2014.26
As already mentioned, silicone replicas are also a useful and inexpensive modality for quantifying pores, although special care must be taken to ensure extremely precise quantities of the silicone resin are combined with the hardening catalyst. Since this is a kinetic reaction, timing is of the utmost importance. Differences in the thickness or flow properties of the silicone-catalyst mixture during application to the skin will affect the polymer’s ability to penetrate deep into the pore. To reiterate, silicone replicas can be evaluated by generating macrophotographic images in the presence of oblique light. Alternatively, one may utilize a flatbed scanner to generate the digital images. Our laboratory’s experience is that both techniques work equally well.
Fringe projection techniques that generate three-dimensional images of the skin surface topography are also used for quantifying pores and provide an estimate of pore volume. An example of skin pore measurement with this technique is provided in Figure 10 utilizing the PRIMOS® premium system. Studies of pore volume with this instrument demonstrated very good correlation with visual grading by trained panelists, illustrating the contribution of pore volume to the overall appearance of facial pores.26 Stereoimaging with an optical topometer is also a viable route for quantifying pores.28
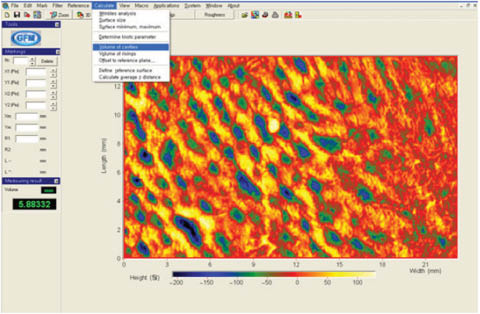
Figure 10: Analysis of pore volume with the PRIMOS premium system. Reprinted from Kim et al. with permission from John Wiley & Sons, © 2014.26
Confocal laser scanning microscopy may also be used to investigate the dimensions of pores.29 While this technique is extremely valuable for investigating the anatomy of the pore, it is not the instrument of choice for quantifying attributes of large numbers of pores due to its limited imaging area. Nevertheless, pertinent information relating the fine morphological structure of skin with pores is invaluable and may provide avenues for future research focused on the reduction of pore size.
The ability to measure the temperature distribution and changes in skin is extremely useful not only from a practical point of view, but also for a more profound understanding of processes occurring within the skin. Skin thermography, or digital infrared imaging, affords the researcher such an avenue to explore various phenomena involving the state of health of the skin. Infrared cameras are designed to measure infrared radiation in the short- to mid-wave (3–5 μm) and long-wave (7–14 μm) regions of the electromagnetic spectrum. These devices essentially measure the emitted energy of the sample. Kirchoff’s law provides us with a general relationship between emitted (E), transmitted (T), and reflected (R) energy:
E+T+R=1 (1)
In many circumstances, the transmitted energy is close to zero and E+R=1. In general, objects that are good emitters are poor reflectors and good reflectors are poor emitters. Not surprisingly, E=1 in the case of a black body—something that absorbs all incident electromagnetic radiation—while most objects in nature result in E<1. In the case of skin, it is both a good absorber of energy and also a good emitter, where E=0.98. In contrast, aluminum foil is a good reflector (R=0.98), but a poor emitter (E=0.02). Nevertheless, skin is a very good object for conducting thermography measurements.
The use of infrared thermography in the medical field has expanded significantly in recent years due to the increasing availability of infrared cameras. Such studies provide data related to inflammatory conditions (injuries, infections, etc.) as well as vascular activity (angiogenesis, varices, etc.). Typically, infrared images, or thermograms, of skin represent thermal energy emission stemming from the outermost portion of the epidermis down to the dermis, roughly 5 mm deep.
In the personal care arena, there are also various applications of infrared thermography. For example, it can be utilized to monitor skin surface temperature when conducting antiperspirant efficacy studies. In a study described in the literature, subjects were first acclimatized in an environmentally controlled room at 28°C and 40% RH for 30 min, and then placed in a sauna at 45°C and 30% RH for an additional 60 min.17 During the test, axillae sweating and eccrine sweat pore activity was monitored by gravimetric analysis and a skin replica technique; however, infrared thermography was utilized to monitor the overall anatomical temperature distribution of each subject. Figure 11 contains a series of images obtained for one of the subjects upon entry into the environmental room, then after 30 min in the room, followed by a period of time spent in the sauna chamber. In Figure 11a, the overall surface temperature of the skin is lower than in Figures 11B–11D. This phenomenon occurred because the subject was acclimatized in an office for several hours beforehand at a much lower temperature than in the environmental room. After 30 min in the environmental room (Figure 11B), the surface temperature of the subject begins to increase, especially in the rostral (facial) region and the superior torso. After 10 min in the sauna (Figure 11C), the peak temperature is reached at the rostral region, superior torso, and lower limbs. The subject begins to sweat profusely after 10 min in the sauna, resulting in an overall cooling effect over all surfaces of the integument as shown in Figure 11D. Subsequent images were obtained at 30, 40, and 50 min, which demonstrated similar behavior as that observed at 20 min. In summary, these data demonstrate that the 30-min acclimatization in the environmental room followed by the first 10 min in the sauna chamber is sufficient to bring the subject to a state of profuse sweating, which can be monitored from that point onward by other tests, such as gravimetric analysis and skin replica techniques.
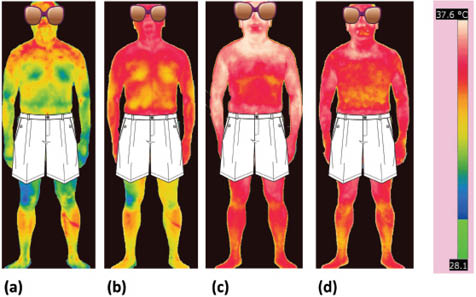
Figure 11: Infrared thermograms of a subject undergoing antiperspirant studies. Images were obtained to monitor the global temperature distribution of the subject during the test. Images were collected upon (a) entry into the environmental room, (b) after 30 min acclimatization in the environmental room, and after (c) 10 min and (d) 20 min in the sauna. The scale for all of the images is provided on the right and ranges from 28.1°C to 37.6°C. Precise measurements of temperature can be made at every pixel in the image. Reprinted from McMullen et al. with permission from the Society of Cosmetic Chemists, © 2013.17
Infrared thermography may also be used to monitor the skin’s response to environmental stress, such as exposure to hot and cold temperatures. For example, one may wish to investigate the use of an active ingredient to mitigate the skin’s response to stress. To carry out such an experiment, one would treat skin with an active ingredient-containing vehicle in the form of a cream at a dose of 2 mg/cm2 to the inner forearm of subjects twice per day. After 3 weeks, baseline readings should be obtained and subjects could be subjected to stress first with a heating pad for 10 min followed by cold pad stress for 10 min (see Figure 12). After application of stressors, thermograms may be obtained every 2–3 minutes for 1 hour. Figure 13 contains an example of a baseline reading and one obtained after exposure to both hot and cold stresses. Since there may be some temperature gradient due to vascularity, care must be taken to obtain temperature readings from selected regions of the images.
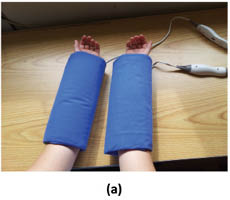
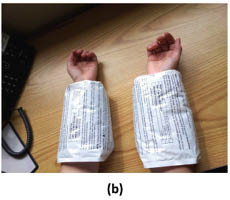
Figure 12: Application of (a) hot and (b) cold pads used to induced stress in skin.
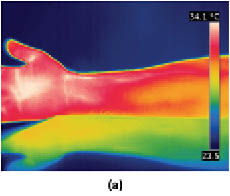
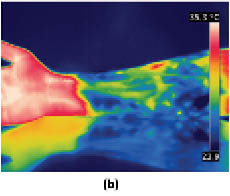
Figure 13: Infrared thermograms of the volar forearm comparing (a) a baseline reading versus (b) the arm after it had undergone a hot and cold stress cycle. Images kindly provided by Mihaela Gorcea, Ashland, Inc.
f. Ultraviolet (UV) Reflectance Photography
Skin pigmentary disorders, such as melasma, vitiligo, and hypopigmentation, as well as disorders resulting from photo-damage, are commonly detected with UV light photography.30 This mode of photography is based on the photo-physical properties of melanin, which absorbs much greater in the UV region of the electromagnetic spectrum than the visible region. Therefore, pigmented and depigmented lesions are more discernible than they would be using visible light photography.31 In fact, the use of UV light photography in dermatology has been in practice for many years. Using Wood’s lamp, which provides broad UVA spectral output with a maximum at 365 nm, dermatologists have been diagnosing pigmentary disorders since the early part of the twentieth century.32,33 This technique is especially useful for monitoring photo-damage or melasma in subjects with Fitzpatrick Skin Types I–III in the case of hyperpigmentation. On the other hand, it readily views hypopigmentation disorders, such as vitiligo, in subjects with Fitzpatrick Skin Types V and VI.
In general, UV photography is conducted with the same type of cameras employed for light photography with some modifications. In order to carry out such experiments, one should employ a camera that is sensitive to UV light. In film photography, high-speed (e.g., ISO 1600) black-and-white film is used due its enhanced sensitivity to the otherwise weak UV signal, and because color film contains a UV-absorbing protective coating. At present, most digital SLRs can be modified so that the CCD or CMOS sensor is sensitive to UV light. Digital SLRs contain a UV and IR filter pack that only allows visible light to reach the sensor. This can be removed by a specialty camera shop and replaced by a UV transmitting filter in front of the sensor (providing a dedicated UV camera) or over the lens.34 Lenses that are able to transmit UV light are readily available, and most macro lenses (made of fluorite and quartz glass) that are used for dermatological photography are suitable for this purpose. Finally, xenon flashes are a good source of UV light as long as the flash diffusers are removed from the flashes (these attenuate UV light) and replaced with UV pass filters.31 The strategic positioning of several flashes around the subject’s face is key to obtaining proper illumination conditions.
Related posts:


Stay updated, free articles. Join our Telegram channel

Full access? Get Clinical Tree


