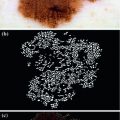
Fig. 1
Dermoscopy images of Caucasians and Chinese. a Dermoscopy images of Caucasians (https://b0112-web.k.hosei.ac.jp/DermoPerl/) b Dermoscopy images of Chinese
Cooperating with the General Hospital of the Air Force of the Chinese People’s Liberation Army, the Image Processing Center of Beihang University in China has been studying the analysis and diagnosis technology of dermoscopy images for Chinese since 2007, including removing hair from images in preprocessing phase, image segmentation, feature extraction and recognition. So far, we are the only one to study the analysis of dermoscopy image of Chinese, and discusses in the chapter is based on our researches.
This study was supported by the Chinese National Natural Science Foundation (Grant Nos. 61027004, 61071138) and the Science Foundation of Beihang University (Grant no. YWF-12- LXGY-013).
Hair Removal from Dermoscopy Image
The factors influencing dermoscopy image quality include defocus blur, poor illumination, weak contrast, hair, air bubble, and other factors. Hair noise is processed in this section. To get the precise segmentation and analysis of the skin malignant melanoma image with hairs, it is very necessary to detect and remove the hair from the image.
In a study conducted in Italy [4], the investigators decided to shave the hairs using a razor before the imaging segmentation. This procedure not only adds extra costs and time to the imaging session, but it is also impractical when applied to total-body nevus imaging [5]. Lee [6] located the hair through morphological closing operator firstly and then removed the hairs from image by replacing the hair pixels by the nearby non-hair pixels, but the algorithm worked well just for the thick and dark hairs. In Literature [7], inpainting performs approximately 33 % better than DullRazor’s linear interpolation, and is more stable under heavy occlusion. Literature [8] achieves automatic hair and ruler marking detection using curve fitting and models curve intersection and replaces the artifact pixels using feature guided, exemplar-based inpainting. In [9], Kimia Kiani et al. firstly detects hair pixels by using Radon transform and the Prewitt filters and then replaces the detected hair pixels with the average gray-level of the background. In [10], Qaisar Abbas et al. proposed a fast marching method for hair removal which includes three steps: (a) initial hair detection by derivative of Gaussian, (b) refine hair detection by morphological technique, (c) repairing of hair-occluded information by fast marching. In [11], the fast marching method is developed.
In the section, we introduce an automatic algorithm to remove hair, which includes three steps [12]:
(1) Enhancing the melanoma image with hairs by morphologic closing-based top-hat operator and thresholding the enhanced image; (2) Extracting out hairs based on the elongate of connected region; (3) Repairing the hair-occluded information using the PDE-based image inpainting technology.
Detecting Hair
The hair objects can be treated as the black structures because the pixels inside the hair are darker than those surrounding it (shown in Fig. 2), thereby hair objects can be enhanced using morphological closing-based top-hat operator.
Fig. 2
Two skin melanoma images with hairs
The morphological top-hat operator for grayscale images is a part of the basic toolbox of mathematical morphology operators [13, 14]. It is often used to detect contrasted objects on non-uniform backgrounds. For grayscale images, there are two versions: the opening-based top-hat operator can extract bright structures in the image, and the closing-based top-hat operator can extract dark structures in the image.
Let the processing image  and the structure element
  are respectively:
![$$\begin{aligned} F=\{[x,f(x)]|x\in P,P\subseteq E^{2}\} \end{aligned}$$](/wp-content/uploads/2017/02/A306585_1_En_5_Chapter_Equ1.gif)
![$$\begin{aligned} B=\{[m,b(m)]|m\in S,S\subseteq E^{2}\} \end{aligned}$$](/wp-content/uploads/2017/02/A306585_1_En_5_Chapter_Equ2.gif)
And then for the image  , the dilating
  and eroding
  by structure element
  at point
  can be written as:
where  means each point
  in the image
  moves along the vector
  .
.
and the structure element are respectively:(1)
(2)
, the dilating and eroding by structure element at point can be written as:(3)
(4)
means each point in the image moves along the vector .The opening  and the closing
  by structure element
  are respectively defined as:
Further the opening-based top-hat  and the closing-based top-hat
  can be respectively written as:
The morphological top-hat operator has the property of high-pass filter. The opening-based top-hat operator, also called peak detector, can extract bright structures in the image. Different with the opening-based top-hat, the closing-based top-hat operator, also called valley detector, can extract black structures in the image.
and the closing by structure element are respectively defined as:(5)
(6)
and the closing-based top-hat can be respectively written as:(7)
(8)
We enhance hair objects on the grayscale image according to Eq. (8). Figure 3a is a dermoscopy image, and Fig. 3b is the result of carrying out the closing-based top-hat on Fig. 3a. From Fig. 3b, the non-hair regions including lesion are weakened, on the contrary, both weak and strong hair objects are greatly enhanced. Enhanced hairs become the bright regions in image, and the area of these bright regions occupied some ratio in the whole image. According to the experience, the ratio is about 5 % with which Fig. 3c is the threshold segment result for Fig. 3b.
Fig. 3
Segmentation of melanoma images with hairs. a Original image b Closing-based top-hat operation c binary image
Figure 3 is an example for black hairs. In fact, the blond or gray hairs are darker than the surrounding background, and thereby they can also be enhanced and detected out from the image. But for those brighter hairs than surrounding background, the opening-based top-hat operator can be used to enhance the hair objects.
Extracting Hairs
From Fig. 3c, with the non-hair noises, the hairs are detected, and the connected regions belonging to hair are bigger and longer than those non-hair connected regions which are smaller and shorter. It is simple to take the length or area size of connected region as measure to extract hairs from image, but some short hairs will not be separated from those long non-hair connected regions.
We use the elongate of connected region as measure to extract the hairs from image. For a band-like connected region, the elongate function is defined as:
Definition 1: For a given connected region  , its expanded area,
  , is the area of the square outspreaded by the central axis, the formula is as follows:

where l is the central axis length of  .
.
, its expanded area, , is the area of the square outspreaded by the central axis, the formula is as follows:(9)
.The geometrical explanation is illustrated in Fig. 4. The broken line in Fig. 4a is the central axis of the connected region, the area of the square in Fig. 4c is just the expanded area of Fig. 4a. From Fig. 4, for a connected region, the longer the central axis is, the bigger its expanded area is.
Definition 2: For a given connected region  , its elongate function
  is the ratio of its expanded area to its real area, the formula is as follows:
where  is the real area of
  .
.
, its elongate function is the ratio of its expanded area to its real area, the formula is as follows:(10)
is the real area of .Fig. 4
The illustration of defined elongate function. a Connected region b Outspreaded region c Outspreaded square
From the Eq. (10), the elongate function  measures the size of expanded area in unit area for connected region and it is related to two variables
  and
and  . Supposing
  is invariable, with the decrease of
  , the connected region will be thinner, its elongate becomes more and more strong, and
  is increasing; Supposing
  is invariable, with the increasing of
  , the connected region will be longer, its elongate becomes more and more strong, and
  is increasing. Thereby the thinner and longer a band-like object is, the bigger the function value
  is.
is.
measures the size of expanded area in unit area for connected region and it is related to two variables and . Supposing is invariable, with the decrease of , the connected region will be thinner, its elongate becomes more and more strong, and is increasing; Supposing is invariable, with the increasing of , the connected region will be longer, its elongate becomes more and more strong, and is increasing. Thereby the thinner and longer a band-like object is, the bigger the function value is.The central axis of one band-like connected region can be obtained by skeleton extraction algorithm based on morphological Hit-Miss transform [15]. And the central axis length  , which is one of the parameters of elongate function, can be calculated according to the central axis locus. Taking the pixel number of connected region as the real area
  , and the elongate function value can be obtained according to Eq. (10).
, which is one of the parameters of elongate function, can be calculated according to the central axis locus. Taking the pixel number of connected region as the real area , and the elongate function value can be obtained according to Eq. (10).The thin and long hair is a kind of band-like object in Fig. 3c, and its elongate feature function value  is bigger than the non-hair connected region. Thereby an appropriate threshold
  can be selected according to real application instance and the hair whose elongate feature function value
  is bigger than
  is determined to be hair object. Figure 5 is the extracted hairs from Fig. 3c with the elongate measure defined by Eq. (10). It can be seen that the elongate feature function proposed in this paper is efficiently measured for extracting hairs.
is bigger than the non-hair connected region. Thereby an appropriate threshold can be selected according to real application instance and the hair whose elongate feature function value is bigger than is determined to be hair object. Figure 5 is the extracted hairs from Fig. 3c with the elongate measure defined by Eq. (10). It can be seen that the elongate feature function proposed in this paper is efficiently measured for extracting hairs.Fig. 5
Extracted hair regions based on elongate measure
Repairing the Hair-Occluded Information
The influence of hair to diagnosis analysis can be eliminated through excluding the hair regions from further analysis. But for the image segmentation, it can improve the veracity of segmentation to repair the melanoma texture occluded by hairs. Thus the PDE-based inpainting method is selected to repair the hair-occluded information in this chapter.
Initially proposed by Perona and Mafik, the non-linear diffusion filters have been widely used in the last decade in edge preserving and enhancement filtering. The gray levels of an image ( are diffused according to [16].
where  is the divergence operator,
  is the gradient operator. the scalar diffusivity
  , in a pixel of coordinates (
 , is chosen as a non-increasing function
  of the Gradient
  , which governs the behavior of the diffusion process. A typica1 choice for the diffusivity function
  is:
is:
where,  is gradient threshold. Practical implementations of the P-M filter are giving impressive results that noise is eliminated and edges are kept or even enhanced provided that their gradient value is greater than
  .
.
are diffused according to [16].(11)
is the divergence operator, is the gradient operator. the scalar diffusivity , in a pixel of coordinates (, is chosen as a non-increasing function of the Gradient , which governs the behavior of the diffusion process. A typica1 choice for the diffusivity function is:(12)
is gradient threshold. Practical implementations of the P-M filter are giving impressive results that noise is eliminated and edges are kept or even enhanced provided that their gradient value is greater than .Equation (12) is an anisotropic partial differential equation. Let  be the original image, and the discrete iterating form of Eq. (12) for image inpainting is:
where, ( is pixel coordinate. D is the neighborhood of (
 pixel.
  is the number of neighborhood pixels. The positive constant
  denotes smooth degree and
  is the iteration times.
be the original image, and the discrete iterating form of Eq. (12) for image inpainting is:(13)
is pixel coordinate. D is the neighborhood of ( pixel. is the number of neighborhood pixels. The positive constant denotes smooth degree and is the iteration times.For color image of skin melanoma, the hair regions extracted from image with elongate measure are taken as mask, and the inpainting result can be obtained through iterating the Eq. (13) repeatedly within the region of the mask respectively in three color bands on the original image. Figure 6 is the inpainting result for Fig. 3a, and it can be seen that the repaired texture of melanoma is consistent with the human vision.
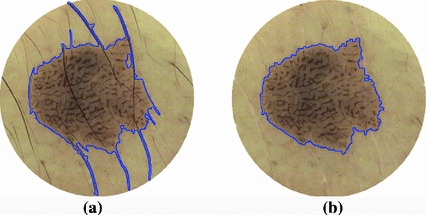
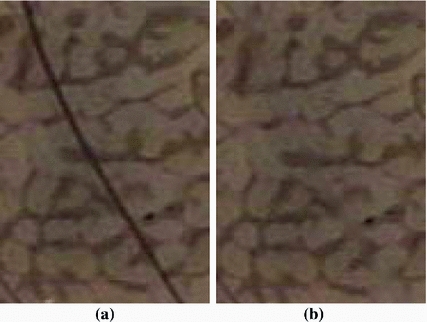
Fig. 8
Segmented result after or before inpainting. a Segmented result before inpainting b Segmented result after inpainting
The automatic repair problem of the hair-occluded information can be resolved very well through combining hair object extraction with image inpainting technology in this section. Figure 7 is the local effect repaired by the method, it can be seen that there is no any blur in the region without hairs and the repaired texture in the hair region is logical. Figure 8 is the segmentation effect by Otsu’s threshold after or before repairing the hair-occluded information, and it can be seen that the segmentation is improved after repairing the hair-occluded information. This introduced method is practical and robust, and the segmentation error of the skin melanoma image with hairs is effectively reduced after repairing the occluded information.
Segmentation Based on SGNN
The segmentation stage is quite important since it affects the accuracy of the subsequent feature extraction and analysis. However, segmentation is quite difficult because [17]: (i) the transition between the lesion and the surrounding skin is usually of low contrast; (ii) the lesion borders are usually irregular and fuzzy; (iii) complicating artifacts are often present such as skin texture, air bubbles and hairs; and (iv) the interior of the lesion may exhibit variegated coloring.
To address these problems, a number of dermoscopic segmentation algorithms have been developed [18]. For convenience, we broadly classify these into three categories: thresholding, edge/contour-based and region-based. An effective thresholding method proposed by Grana [19] uses Otsu’s threshold to automatically segment the melanoma image, then selects  points for spline-based interpolation, yielding a smoothed lesion border. Thresholding methods such as this can achieve good results when there is good contrast between lesion and skin, but encounter problems when the modes of the two regions overlap. Edge/contour-based approaches were used in [20, 21]. Rubegni [20] segmented dermoscopy images using the zero-crossings of a LoG edge operator, while Zhou [21] used an improved snake model to detect lesion borders. Edge and contour-based approaches perform poorly when the boundaries are not well defined, for instance, when the transition between skin and lesion is smooth. In such situations, the edges have gaps and the contour may leak through them. Region-based approaches have also been used. Some examples include multi-scale region growing [22], fuzzy c-means based on anisotropic mean shift [23], multi-resolution Markov random fields [24] and statistical region merging (SRM) [17]. Region-based approaches have difficulties when the lesion or the skin region is textured, or has different colors presentation, which can lead to over-segmentation.
points for spline-based interpolation, yielding a smoothed lesion border. Thresholding methods such as this can achieve good results when there is good contrast between lesion and skin, but encounter problems when the modes of the two regions overlap. Edge/contour-based approaches were used in [20, 21]. Rubegni [20] segmented dermoscopy images using the zero-crossings of a LoG edge operator, while Zhou [21] used an improved snake model to detect lesion borders. Edge and contour-based approaches perform poorly when the boundaries are not well defined, for instance, when the transition between skin and lesion is smooth. In such situations, the edges have gaps and the contour may leak through them. Region-based approaches have also been used. Some examples include multi-scale region growing [22], fuzzy c-means based on anisotropic mean shift [23], multi-resolution Markov random fields [24] and statistical region merging (SRM) [17]. Region-based approaches have difficulties when the lesion or the skin region is textured, or has different colors presentation, which can lead to over-segmentation.Color is a significant feature for image segmentation and unsupervised color clustering [25] has been successfully used for region-based segmentation. Such data-driven methods have great potential of dealing with varied imaging situations, provided that an accurate model that is flexible enough to span the space of possible lesion image environments can be found. Since modeling such a high-dimensional complex space of possibilities is quite difficult, learning-based methods that can be trained on large datasets are of interest. Towards this end, we introduce a color clustering model for dermoscopy images [26] that combines the technique of the self-generating neural network (SGNN) with genetic algorithms (GA). Using a measure of cluster validity, the clustering algorithm that we develop automatically determines an appropriate number of clusters. By merging the clustering regions into lesion and background skin, segmentation of dermoscopy images is achieved.
Self-generating Neural Networks
SGNN is proposed as one of the competitive learning neural networks firstly by Wen [27], and then is in-depth researched by Inoue [28, 30], which is characterized by simplicity in network design, fast in learning and self-organizing ability, thus can be competent for the clustering or classification with high performance [27–29].
As shown in Fig. 9, the SGNN has been implemented as a self-generating neural tree (SGNT) which is a tree structure for hierarchical classification. Figure 9a is a clustering sample set, where  is the sample attribute. Figure 9b is the generated SGNT for Fig. 9a according to the SGNT generating rules [27, 28], where
  notes the neuron weight. Each leaf neuron corresponds to one or multiple samples, and its weight is the average attribute of the corresponding samples. For the SGNT, every leaf neuron is corresponding to one or multiple samples, and its weight is the attribute average of the corresponding samples, and the weight of every node neuron (non-leaf neuron) is the attribute average of all the leaf neurons covered by this node neuron. Taking every child of the root neuron as a cluster center, all of the leaf neurons in the sub-network rooted by this child belong to the same cluster, and the number of the clusters is just the number of the root neuron’s children. Obviously, in the Fig. 9b, A is in the same cluster with B; C is in the same cluster with D and E, and the number of the clusters is 2. It may refer to references [27–30] for more details about SGNN and pass over the further discussion here. Taking the image pixels as clustering samples and the color or coordinates information as sample attributes, SGNN can be used for image clustering.
is the sample attribute. Figure 9b is the generated SGNT for Fig. 9a according to the SGNT generating rules [27, 28], where notes the neuron weight. Each leaf neuron corresponds to one or multiple samples, and its weight is the average attribute of the corresponding samples. For the SGNT, every leaf neuron is corresponding to one or multiple samples, and its weight is the attribute average of the corresponding samples, and the weight of every node neuron (non-leaf neuron) is the attribute average of all the leaf neurons covered by this node neuron. Taking every child of the root neuron as a cluster center, all of the leaf neurons in the sub-network rooted by this child belong to the same cluster, and the number of the clusters is just the number of the root neuron’s children. Obviously, in the Fig. 9b, A is in the same cluster with B; C is in the same cluster with D and E, and the number of the clusters is 2. It may refer to references [27–30] for more details about SGNN and pass over the further discussion here. Taking the image pixels as clustering samples and the color or coordinates information as sample attributes, SGNN can be used for image clustering.Fig. 9
The structure of the SGNT. a 5 samples b Generated SGNT for (a)
In spite of its fitting capacity for clustering, the SGNN algorithm is influenced by the input order of the training samples, which can cause inconsistent clustering results, as depicted in Fig. 10, where Fig. 10a is the original image, and Fig. 10b, c are the results that are achieved when different samples are selected as the first input into the SGNT.
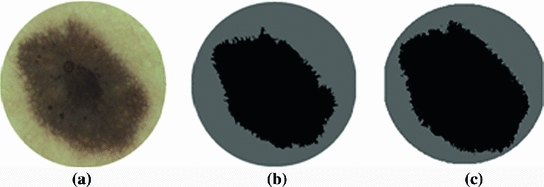
Fig. 10
Different clustering results using SGNN with different input order of samples. a Original image. b Clustering result 1. c Clustering result 2
In Fig. 10b, the area of the lesion is under-segmented, whereas a more accurate result is obtained in Fig. 10c. To ameliorate this in [26], the SGNT is generalized to a Self-Generating Neural Forest (SGNF), and GA is subsequently employed to consistently select an appropriate group of seed samples as the first input into the SGNF, thereby yielding optimized clustering results.
Self-generating Neural Forest
The SGNT can be generalized to a Self-Generating Neural Forest (SGNF) as follows. Suppose that a given sample set has  cluster centers. Then the SGNF generating algorithm can be described as follows:
cluster centers. Then the SGNF generating algorithm can be described as follows:Step 1: Remove  seed samples randomly from the sample set, treating these seeds as initial neural trees to form an initial forest;
seed samples randomly from the sample set, treating these seeds as initial neural trees to form an initial forest;Step 2: Generate neuron n  for sample i, then search each SGNT in the SGNF to find the neuron n
  at the shortest distance from neuron n
  ;
;
for sample i, then search each SGNT in the SGNF to find the neuron n at the shortest distance from neuron n ;Step 3: Connect the n  into the SGNT covering the neuron n
  ;
;
into the SGNT covering the neuron n ;Step 4: Repeat steps 2 and 3 until all samples are input into the SGNF;
The generated SGNF includes  SGNTs, each SGNT corresponding to a cluster, and all the leaf neurons in a SGNT belong to the same cluster. Whereas, the number of clusters based on SGNF is user-specified.
SGNTs, each SGNT corresponding to a cluster, and all the leaf neurons in a SGNT belong to the same cluster. Whereas, the number of clusters based on SGNF is user-specified.Optimal Clustering by Genetic algorithm
GAs [31–33] are efficient searching algorithms as well as a stochastic search technology based on natural selecting and genetics principle, and they are capable of adaptively searching solution space for optimal solution and thus successfully used for pattern classification including clustering of data [34–36]. The relevant steps of GA are:
Step 1: Randomly generate an initial population G(0);
Step 2: Evaluate the fitness f(m) of each individual m in the current population G(t);
Step 3: Execute genetic operators including selection, crossover and mutation;
Step 4: Generate the next population G(t+1) using genetic operators;
Step 5: Return to Step 2 until the maximum of the fitness function is obtained.
The clustering results derived from the SGNF generating algorithm are influenced by the  seed samples used to generate the initial neuron forest. Suppose we partition the sample set X into
  clusters
  ; then their cluster centers are
  respectively, and the between-class variance can be estimated:
 Network Detection and Analysis
 Analysis in Dermoscopic Images
 Skin Reflectance and Geometry for Diagnosis of Melanoma
 Diagnosis of Melanoma Based on the 7-Point Checklist
 Decision Support Using Lighting-Corrected Intuitive Feature Models
 Bag-of-Features Approach for the Classification of Melanomas in Dermoscopy Images: The Role of Color and Texture Descriptors


seed samples used to generate the initial neuron forest. Suppose we partition the sample set X into clusters ; then their cluster centers are respectively, and the between-class variance can be estimated:Related posts:
Network Detection and Analysis
Stay updated, free articles. Join our Telegram channel
Full access? Get Clinical Tree
