Fig. 1
Example of local patterns
Local patterns can be presented in the lesion with an irregular/regular or atypical/typical nature, implying malignancy or not. Figure 1 shows some examples of local patterns.
In the literature we can find numerous works that are focused on the automatic identification of local features. They are briefly explained in the subsections below.
Pigment Network
The pigment network is the most studied local pattern. The reason is that it is the most common local pattern in melanocytic lesions, and the identification of melanocytic lesions is the first step in the procedure of pigmented skin lesion diagnosis as explained in the Introduction Section. A pigment network can be typical, when the pattern is regularly meshed, narrowly spaced and its distribution is more or less regular, or atypical, characterized by a black, brown, or grey, irregular network, distributed irregularly throughout the lesion. An atypical network signals malignancy [4]. Figure 2 shows the variability of its appearance.
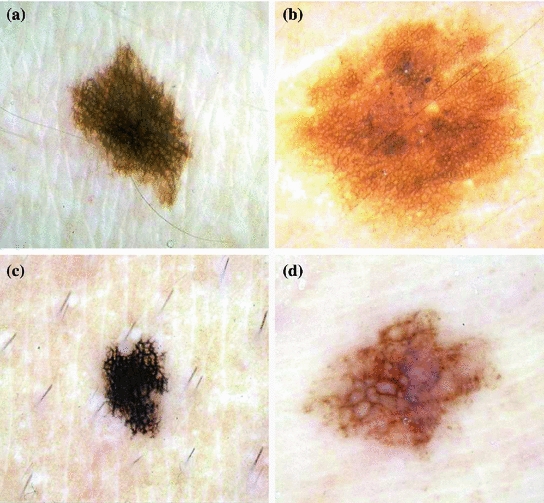
Fig. 2
Example of lesions with pigment network. a and b present typical pigment network, whereas c and d atypical
In the last years several authors have focused on the automatic detection of this pattern.
Anantha et al. [2] in 2004 compared two statistical texture identification methods for detecting the pigment network. The first method was the neighboring grey-level dependence matrix (NGLDM), and the second method used the lattice aperture waveform set (LAWS). They analyzed images of  pixels. The authors concluded that both methods detect grossly any pigment network with reasonable accuracy, with slightly better results obtained by the latter. 155 dermatoscopic images were analyzed, including 62 malignant melanomas and 93 benign lesions. The success classification percentage was around 78 % and 65 % for LAWS and NGLDM, respectively.
pixels. The authors concluded that both methods detect grossly any pigment network with reasonable accuracy, with slightly better results obtained by the latter. 155 dermatoscopic images were analyzed, including 62 malignant melanomas and 93 benign lesions. The success classification percentage was around 78 % and 65 % for LAWS and NGLDM, respectively.Grana et al. [23] in 2006 presented an approach that addressed the problem of detecting the pigment network based on the work of linear structure identification presented in [48], applied to dermatological images by Fleming et al. [21] in 1998. Line points detection was satisfied considering the lines of the pigment network as ridges. As a consequence this set of points must satisfy at the same time two conditions: the first order derivative should be zero, while the second order derivative should have a high module value. After the detection of lines from the zeros of the first derivative, Fleming et al. [21], following the procedure presented in [48], closed lines through an analysis of the second derivative. However, Grana et al. [23] made use of a set of morphological masks that rotate in different directions in order to identify the terminations of the lines and, subsequently, line linking. The thinning approach worked by selectively eroding line points which matched with exactly only one of the morphological masks checking for the presence of an ‘L’ shaped point which is not an 8-connection between two different network segments. ‘T’ shaped connections were eroded with another set of masks. After the network extraction, the image was divided into eight sectors oriented along the principal axes, in order to provide some statistics on the network characteristics of the whole lesion and of every eighth thereof counting the number of meshes, along with the number of unclosed terminations and the average line width. A set of 60 selected lesions was examined. Interestingly, the authors classified each lesion with regard to the distribution of the pigment network as no network pattern, partial network pattern if the lesion is partially covered with pigment network and complete network pattern. An overall 88.3 % network detection performance, without failed detections, was achieved.
Shrestha et al. [45] presented a study in 2010, whose purpose was to identify a method that could discriminate malignant melanoma with an irregular texture, most commonly an atypical pigment network (APN), from benign dysplastic nevi, which generally do not have an APN, using texture measurements alone. In this study, a gray-level co-occurrence matrix (GLCM) is constructed from the luminance plane. Five different GLCMs were constructed for each image using pixel distances (d-values) of 6, 12, 20, 30, and 40. Five classical statistical texture measures were calculated from each GLCM: energy, inertia, correlation, inverse difference, and entropy. Both the average and the range of each of these measures were computed, yielding 10 parameters related to texture. These parameters fed six different classifiers (BayesNet, ADTree, DecisionStump, J48, NBTree, and Ran- dom Forest) in order to determine whether an image presented pigment network or not. The method was tested with 106 dermoscopy images including 28 melanomas and 78 benign dysplastic nevi. The dataset is divided into APN areas and non-APN area. 10-fold validation is employed to validate the method. The correlation average provided the highest discrimination accuracy(95.4 %). The best discrimination of melanomas is attained for a d-distance of 20.
Sadeghi et al. [42] proposed a method to detect and classify the dermoscopic structure pigment network. The method was based on the detection of the ‘holes’ of the network and follows the next steps: image enhancement, pigment network detection, feature extraction, and classification in three classes. First, a two-dimensional high-pass filter was applied to highlight texture features. Then, the lesion was segmented using Wighton et al. method [54] which employed supervised learning and the random walker algorithm. In the pigment network detection step, a Laplacian of Gaussian (LOG) filter was used to detect sharp changes of intensity. Then, the resulting binary image was converted into a graph using 8-connected neighbouring. Cyclic structures were found in this graph, and noise or undersired cycles were removed. Lines and holes of the pigment network were identified and 69 clinically inspired features were extracted: 20 structural features, including network thickness and its variation within the lesion, as well as size of the holes and its variation along the network; 2 geometric features to study the ’uniformity’ of the network; 37 chromatic features; and 10 textural features, using the five classical statistical texture measurements, also proposed in [45]. This allowed to classify the network into typical or atypical type. These 69 features were fed into a classifier based on a powerful boosting algorithm LogitBoost. A dataset consisting of 436 images (161 Absent, 154 Typical network, 121 Atypical network) was used. The authors computed results for both the 3-class (Absent, Typical or Atypical) and 2-class problems (Absent, Present). Ten-fold cross validation was used to generate all results. An accuracy of 82 % discriminating between three classes and an accuracy of 93 % discriminating between two classes were achieved. In [43], the same authors, according to the density of the pigment network graph, classified a given image into Present or Absent. The method was evaluated with 500 images obtaining an accuracy of 94.3 %.
In 2011 Wighton et al. [53] proposed the use of supervised learning and MAP estimation for automated skin lesion diagnosis. The authors applied this method to three task: segmentation, hair detection and identification of pigment network. The method was divided into three main steps. First, in a feature extraction stage, images were converted to CIE  [37], and each color channel was filtered with a series of Gaussian and Laplacian of Gaussian filters at various scale (
 ), so that a total of 30 features were obtained for each pixel. Secondly, after feature extraction, Linear Discriminant Analysis (LDA) was used to reduce the dimensionality. Finally, the posterior probabilities
  (
( ,
,  ) in this subspace were modelled as multivariate Gaussian distributions. In the training phase, parameters for multivariate Gaussian distributions of each class were estimated. And in the labelling stage, individual pixels from previously unseen images were assigned a label using MAP estimation. A training dataset consisting in 20 images where pigment network was present across the entire lesion and 20 images absent of pigment network was employed. All the images belonged to the dermoscopy atlas presented in [4], where labels of ‘present’ or ‘absent’ of pigment network are supplied for each image. Pixels from the training images were assigned a label as ‘background’, ‘absent’ or ‘present’. To label a new unseen image, features were computed as in the training phase and the dimensionality of the feature space is reduced. To estimate the probability that a pixel
  was labelled
  (
( ) the authors assigned the most probable label according to MAP estimation.
[37], and each color channel was filtered with a series of Gaussian and Laplacian of Gaussian filters at various scale (), so that a total of 30 features were obtained for each pixel. Secondly, after feature extraction, Linear Discriminant Analysis (LDA) was used to reduce the dimensionality. Finally, the posterior probabilities (, ) in this subspace were modelled as multivariate Gaussian distributions. In the training phase, parameters for multivariate Gaussian distributions of each class were estimated. And in the labelling stage, individual pixels from previously unseen images were assigned a label using MAP estimation. A training dataset consisting in 20 images where pigment network was present across the entire lesion and 20 images absent of pigment network was employed. All the images belonged to the dermoscopy atlas presented in [4], where labels of ‘present’ or ‘absent’ of pigment network are supplied for each image. Pixels from the training images were assigned a label as ‘background’, ‘absent’ or ‘present’. To label a new unseen image, features were computed as in the training phase and the dimensionality of the feature space is reduced. To estimate the probability that a pixel was labelled ( ) the authors assigned the most probable label according to MAP estimation.Skrovseth et al. [47] also proposed a pattern recognition technique with supervised learning to identify pigment network. They selected a training set consisting of a large number of small images containing either a sample of network or a sample of other textures, consisting of both skin and lesion regions. 20 different texture measures were analyzed and the three that contributed maximally to separate the two classes with a linear classifier were selected. A new image is divided into overlapping subimages of the same size as the training images. A pixel is classified as network if at least one of the subimages it belongs to is classified as it.
Barata et al. [7] presented a work focused on the detection of pigment network in 2012. The method was based on the use of directional filters. The first step was to convert the color image into a grey scale one to remove two types of artifacts: hair and reflections caused by the dermatological gel. An inpainting technique was applied. In the second step, regions with pigment network were detected using two of its distinctive properties: intensity and geometry or spatial organization. A bank of directional filters was applied to perform an enhancement of the network. The spatial organization was implemented by connectivity among pixels. The result was a binary net-mask. The final step aimed to assign a binary label to each image: with or without pigment network. To accomplish this objective, features which characterize the topology of the detected regions in a given image were extracted and used to train a classifier using a boosting algorithm. The algorithm was tested on a dataset of 200 dermoscopic images (88 with pigment network and 112 without) achieving a sensitivity of 91.1 %, a specificity of 82.1 % and an accuracy of 86.2 % in the classification with or without pigment network.
Betta et al. [9] proposed a method for the detection of atypical pigment network. The method was based on their previous work [8], where the pigment network was detected but not classified as atypical/typical. The authors combined two different techniques: structural and spectral analysis. The structural analysis searched for primitive structures such as lines and/or points. To identify these local discontinuities the monocromatic image was compared with a median filtered version of it. In the spectral analysis the Fourier transform of the monocromatic image was performed in order to determine the spatial period of the texture. In this way, local discontinuities, not clearly associated with the network, were disregarded. The result of this phase was a ‘regions with network’ mask. This mask in conjunction with ‘local discontinuities’ image provided a ‘network image’, where the areas belonging to the lesion and constituting the pigment network were highlighted. Two indices related to the spatial and chromatic variability of these areas were presented to quantify the possible atypical nature of the network. 30 images were processed to assess the performance of this detection.
Di Leo et al. [19] extended the work proposed by Betta et al. [9] to detect atypical pigmented network. First, the pigment network was detected following [9]. Then, 13 color and geometric features were extracted. C4.5 algorithm was used as classifier. 173 digital dermoscopy images (77 atypical pigment network, 53 typical pigment network and 43 absent pigment network) obtained from the Interactive Atlas of Dermoscopy [4] were used. 90 images were used for training and 83 images for testing. Sensitivity and specificity values greater than 85 % were reached.
In Table 1 the classification results of the works reported in this section are summarized.
Table 1
Results of pigment network detection
Algorithm | Year | Classification | Accuracy (%) | No. images |
|---|---|---|---|---|
Anantha et al. [2] | 2004 | Absent/present | 78 | 155 |
Grana et al. [23] | 2006 | No/Partial/complete | 88.3 | 60 |
Shrestha et al. [45] | 2010 | Melanoma/no | 95.4 | 106 |
Sadeghi et al. [42] | 2010 | Absent/present | 93 | 436 |
Sadeghi et al. [42] | 2010 | Absent/atypical/typical | 82 | 436 |
Skrovseth et al. [47] | 2010 | Absent/present (per-pixel) | – | – |
Wighton et al. [53] | 2011 | Absent/present (per-pixel) | – | 734 |
Barata et al. [7] | 2012 | Absent/present | 86.2 | 200 |
Betta et al. [9] | 2006 | Atypical/typical | – | 30 |
Di Leo et al. [19] | 2008 | Atypical/typical | 85 | 173 |
Dots and Globules
Dots and globules are round or oval, variously sized black, brown or grey structures, as it has already mentioned in Local Pattern Analysis. It is another dermoscopic structure which is difficult to discriminate from pigment network [42]. This could be the reason why there are so few works in the literature focused on its identification. Some examples of lesions with this structures are shown in Fig. 3.
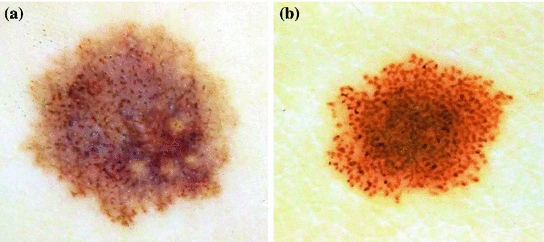
Fig. 3
Example of lesions with dots/globules
Based on the classification described in [35], Skrovseth et al. [47] computed a score for each pixel in a gray scale image. Given  surrounding pixels with values
  ,
,  at a radius
  of a central pixel with gray value
  , the score of the central pixel is calculated as
  . The authors argue that this score will be large for a dark spot, and therefore, a simple thresholding would give the position of the dot.
surrounding pixels with values , at a radius of a central pixel with gray value , the score of the central pixel is calculated as . The authors argue that this score will be large for a dark spot, and therefore, a simple thresholding would give the position of the dot.Yoshino et al. [56] presented an algorithm that use morphological closing operation to detect dots. The closing operation used a linear structural element. Afterwards, a thresholding is applied to detect dots.
Streaks
Streaks are brownish-black linear structures of variable thickness that are found in benign and malignant lesions. They are typically placed at the periphery of a lesion and are not necessarily connected to the lines of the pigment network. Streaks can be irregular, when they are unevenly distributed (malignant melanoma), or regular (symmetrical radial arrangement over the entire lesion) [10]. An example of regular and irregular streaks can be found in Fig. 4 .
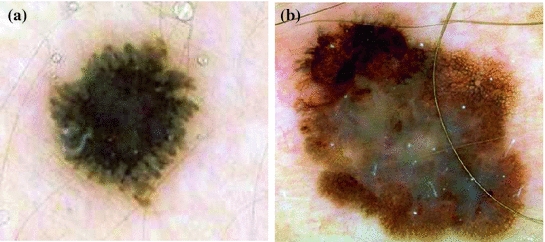
Fig. 4
Example of lesions with (a) regular streaks, (b) irregular streaks
Mirzaalian et al. [34] proposed a a machine-learning approach to detect streaks which captures the quaternion tubularness in the color dermoscopic images. First, tubularness filters [22] to enhance streak structures in dermoscopic images were used. Given the estimated tubularness and direction of the streaks, a vector field in order to quantify radial streaming pattern of the streaks was defined. Specifically, they computed the amount of flux of the field passing through iso-distance contours of the lesion, where each contour was the loci of the pixels which have equal distance from the outer lesion contour. So, an appearance descriptor based on the mean and variance of the flux through the different concentric bands of the lesion is constructed. The final step is to learn how the extracted descriptors can best distinguish the three different classes: the absence, presence of regular, or presence of irregular streaks in the dermoscopic images. This task is performed with a SVM classifier with a database 99 dermoscopic images.
In [41], the authors followed four steps to locate streaks: preprocessing, blob detection, feature selection and two-class classification (absent-present). In the preprocessing step, lesions were segmented, reoriented so that the major axis was parallel to the x-axis and resized so that its major axis occupied 500 pixels. Lightness component (L*) from L*a*b* color representation was used for the rest of the analysis. Streaks can be modeled as linear structures with a Gaussian cross-section profile near the border. Therefore, in the blob detection, four Laplacian of Gaussian (LOG) filters with different sizes, hsize = 3, 5, 7, 9, were employed to detect these linear structures. Candidate to streaks were extracted in this step. Once they were detected, their orientations were estimated using the Averaged Squared Gradient Flow (ASGF) algorithm [29]. Then, 25 features were extracted from the candidate linear streak structures and from the lesion: one set of 12 features was based on properties of the detected candidate streak lines and another feature set contained the 13 common color and texture features of the entire lesion. These 25 features were fed to a SimpleLogistic classifier, that classifies a lesion into absence and presence of streaks. The method was tested with a database of 300 dermoscopic images (105 Absent and 195 Present) achieving an accuracy detection of 0.815 using 10-fold cross validation.
Sadeghi et al. [39] recently presented an extension of their previous work [41]. In this version, they proposed an algorithm that classifies a lesion into absence of streaks, regular streaks, and irregular streaks. The work aimed to identify valid streak lines from the set of candidate streak lines obtained in [41] in order to reduce false positive streaks such as hairs and skin lines. The method also extends the analysis to identify the orientation and spatial arrangement of streak lines. These novel geometric features are used to identify not only the presence of streak lines, but whether or not they are Irregular or Regular; important for melanoma diagnosis. Therefore, a total of 31 features are fed into a classifier, achieving an accuracy of 76.1 % when classifying 945 images into the three classes.
Betta et al. [8] identified streaks as finger-like irregularities with uniform brown color at the lesion contour. Therefore, they detected the simultaneous occurrence of two different structures: finger-like track of the lesion contour, and brown pigmentation in the same restricted region. For the first purpose, the color image was converted to an 8-bit gray-level image, and then three different binary images were obtained by applying three different thresholds. The contours of these binary images were extracted by a blob-finding algorithm. The best of the three extracted contours was selected manually and divided into 16 parts. For each part, an irregularity ratio was evaluated. This parameter represented the ratio between number of pixels of the detected contour in this part and the number of pixels in the line connecting the extreme contour points of this part. The contour in that region was assumed as irregular if the ratio was greater than a threshold. On the other hand, brown pigmentation of those 16 subimages is analyzed by thresholding the hue component. Finally, the occurrence of streaks was assumed only if both an irregular contour and a brown pigmentation were found in the same sub-image. The authors presented experimental results for 10 images achieving a 90 % of success rate. A further evaluation was presented by Fabbrocini et al. [20]. They used 23 and 30 images for training and test set, respectively. The two thresholds mentioned above were determined by a Receiver Operating Characteristic curve (ROC curve) on the training image set. A sensitivity and a specificity of 86 and 88 %, respectively, were achieved.
Table 3 summarizes the classification results of the works reported in this section.
Table 3
Results of streaks detection following pattern analysis and 7-Point Checklist
Algorithm | Year | Classification | Accuracy (%) | No. images |
|---|---|---|---|---|
Mirzaalian et al. [34] | 2012 | Absent/regular/irregular | 91 | 99 |
Sadeghi et al. [39] | 2013 | Absent/present | 78.3 | 945 |
Sadeghi et al. [39] | 2013 | Absent/regular/irregular | 76.1 | 945 |
Betta et al. [8] | 2005 | Absent/present | 90 | 10 |
Fabbrocini et al. [20] | 2010 | Absent/present | 86 | 30 |
Blue–Whitish Veil
Blue-whitish veil is characterized by a grey-blue to whitish-blue diffuse pigmentation. Some examples of lesions that present this pattern are shown in Fig. 5.
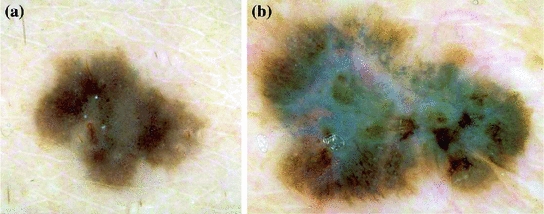
Fig. 5
Example of lesions with blue–whitish veil
Celebi et al. [13] proposed a machine learning approach to detect blue-white veil in dermoscopy images based on their early work [12]. Fifteen color features and three texture features were extracted. The color features involved absolute color features and relative color features when compared to the average color of the background skin. The texture features were based on the gray level co-ocurrence matrix (GLCM). The classifier used was C4.5 algorithm. Only 2 out of the 18 features were finally selected for the classification model, both belonging to color features. The classification results for manually selected test pixels yield a sensitivity of 84.33 % and a specificity of 96.19 %. In a second experiment, the authors aimed to discriminate between melanoma and benign lesions based on the area of the blue–white veil detected. They extracted three numeric values from the detected blue-white region: area, circularity and ellipticity. A new classification model based on these features was generated using C4.5 algorithm and 10-fold-cross validation. A sensitivity of 69.35 % and a specificity of 89.97 % for the entire image set (545 images) were obtained.
In a recent work, Arroyo et al. [6] also proposed supervised machine learning techniques to detect blue-white veil. To this aim, color features were extracted from each individual pixel and the classifier used was C4.5 algorithm, that generated the decision tree. Candidate areas selected in the previous step were subsequently classified as melanoma with blue-white veil. For this purpose 12 features were extracted from the candidate area such as area, solidity or ellipticity. The authors used a database consisting of 887 images. 120 images were selected to obtain the training data, 60 corresponding to melanoma with blue-white veil pattern and 60 corresponding to other cases. The method achieved a sensitivity of 80.50 % and a specificity of 90.93 %
Di Leo et al. [17] focused on the detection of two different patterns, blue-whitish veil and regression structures. Firstly, the lesion was subdivided into regions. The color image is converted via principal component analysis (PCA) and a two dimensional (2-D) histogram is computed with the two first principal components. The most significant peaks in the 2-D histogram were found as representative of color regions in the input image. All the pixels in the lesion were assigned to one the main peaks via clustering, so that a lesion map was created. Regions in the lesion map were subsequently classified as present or absent of blue whitish veil and regression. To this aim geometric and color features were extracted and a logistic model tree (LMT) was proposed as classifier. 210 digital dermoscopic images obtained from the Interactive Atlas of Dermoscopy [4] were used. 70 and 50 cases corresponding to the presence of Blue Veil and Regression area respectively were used as training set. 65 cases of Blue Veil and 40 cases of Regression structures were utilized for the test set. A sensitivity of 0.87 and a specificity of 0.85 were obtained for the detection of blue veil and a sensitivity and a specificity both equal to 0.85 for regression structures.
Related posts:
 Network Detection and Analysis
Stay updated, free articles. Join our Telegram channel

Full access? Get Clinical Tree


