1 mm) is between 91.8 and 98.1 % [4]. Epiluminescence microscopy (ELM) is an in vivo, non invasive technique that has disclosed a new dimension of the clinical morphologic features of pigmented skin lesions, using various incident light magnification systems with an oil immersion technique [2, 3]. Results of previous studies demonstrated that ELM improves accuracy in diagnosing pigmented skin lesions from 10 to 27 % when compared to clinical diagnosis by the naked eye [5].
Three diagnostic models with similar reliability have become more widely accepted by clinicians: 1. pattern analysis, which is based on the “expert” qualitative assessment of numerous individual ELM criteria; 2. the ABCD-rule of dermoscopy which is based on a semi-quantitative analysis of the following criteria: asymmetry (A), border (B), color (C) and different dermoscopic (D) structures; 3. the ELM 7-Point Checklist scoring diagnosis analysis, proposed by Argenziano et al. defining seven standard ELM criteria: Atypical pigment network, Blue-whitish veil, Atypical vascular pattern, Irregular streaks, Irregular pigmentation, Irregular dots/globules, Regression structures. The ELM 7-Point Checklist provides a simplification of standard pattern analysis and, if compared to ABCD, allows less experienced observers to achieve higher diagnostic accuracy values [6].
The 7-Point Checklist
The 7-point checklist is a diagnostic method that requires the identification of only 7 dermoscopic criteria to help clinicians to use dermoscopy. This simplified algorithm has been shown to be reproducible with non-expert dermatologists, who were able to classify a high percentage of melanomas [6].
In the original paper on the 7-point checklist, dermoscopic images of melanocytic skin lesions were studied to evaluate the incidence of 7 standard criteria. These features were selected for their frequent association with melanoma.
Table 1
Dermoscopic criteria and scores according to the 7 point checklist method
ELM criterion | Definition | Score |
|---|---|---|
Atypical pigment network | Prominent (hyper-pigmented and broad) network with irregular shape or distribution | 2 |
Blue-whitish veil | Irregular, confluent, gray-blue to whitish blue pigmentation not associated with red-blue lacunes or maple leaf pigmentation | 2 |
Atypical vascular pattern | Linear, dotted or globular red structures irregularly distributed outside areas of regression | 2 |
Irregular streaks | Radially and asymmetrically arranged linear or extensions at the edge of the lesion | 1 |
Irregular pigmentation | Brown, gray and black areas of diffuse pigmentation with irregular shape or disruption and abrupt end | 1 |
Irregular dots/globules | Black, brown or blue round structures irregularly distributed within the lesion | 1 |
Regression structures | White areas, peppering, multiple blue-gray dots associated | 1 |
The 7 standard criteria are briefly defined in Table 1 along with the corresponding histological correlates and the scoring system (the 3 major criteria have a score of 2 points and the 4 minor criteria a score of 1 point). The differences between melanomas and nevi were evaluated by a univariate statistical test and the significant variables were used for stepwise logistic regression analysis to determine their diagnostic weights in the diagnosis of melanoma, as expressed by odds ratios. Using the odds ratios calculated with multivariate analysis, a score of 2 was given to the 3 criteria with odds ratios  5, termed “minor” criteria. The total score for the lesion is obtained by simple addition of the individual scores for each detected criterion. In order to diagnose a melanoma, the identification of at least 2 melanoma-specific dermoscopic criteria is required, i.e. a minimum total score of 3 (1 major plus 1 minor or 3 minor criteria). Figure 1 shows a diagnosis example where different structures are present and scores corresponding to melanomas are computed.
5, termed “minor” criteria. The total score for the lesion is obtained by simple addition of the individual scores for each detected criterion. In order to diagnose a melanoma, the identification of at least 2 melanoma-specific dermoscopic criteria is required, i.e. a minimum total score of 3 (1 major plus 1 minor or 3 minor criteria). Figure 1 shows a diagnosis example where different structures are present and scores corresponding to melanomas are computed.Fig. 1
Application of the 7-point checklist to the digital ELM image of a pigmented skin lesion: blue-whitish veil (score 2) + atypical pigment network (score 2) + irregular pigmentation (score 1) + irregular dots/globules (score 1)  total score 6. In order to diagnose a melanoma, the identification of at least 2 melanoma-specific dermoscopic criteria is required: in fact, a minimum total score of 3 is required (1 major plus 1 minor or 3 minor criteria). Histology confirmed the diagnosis of melanoma. Source of this figure: www.dermoscopy.org
total score 6. In order to diagnose a melanoma, the identification of at least 2 melanoma-specific dermoscopic criteria is required: in fact, a minimum total score of 3 is required (1 major plus 1 minor or 3 minor criteria). Histology confirmed the diagnosis of melanoma. Source of this figure: www.dermoscopy.org Like most other diagnostic algorithms, the 7-point checklist was developed and validated retrospectively on a set of 342 dermoscopic images of histologically proven melanocytic skin lesions (the sensitivity and specificity of melanoma detection were 95 and 75 %, respectively). Argenziano et al. showed that the ELM 7-point checklist, in the hands of experienced observers, gave the greatest sensitivity value (95 %), especially in the subgroup of early cutaneous melanoma. Compared with overall ELM diagnosis, the specificity was lower (75 vs. 90 %) because of the tendency to overclassify melanocytic nevi (especially the atypical types) as melanomas with the scoring diagnostic systems. A decrease in specificity may result in some increase in biopsy examinations of benign lesions, but the increase in sensitivity would decrease the chances of missing melanomas. The authors designed a model that requires the identification of only 7 standard ELM criteria, thus enabling even the less experienced clinician to use the method. In fact, this simplified scored pattern analysis was shown to be reproducible not only with a test set performed by experts but also by less experienced dermatologists, who were able to classify a high percentage of melanomas (85–93 %). The lower specificity values (45–48 %) obtained by the less experienced observers could be explained by the fact that most of the non-melanomas used to determine specificity were clinically atypical (leading to the decision to perform a biopsy); thus, they require more experience to perform correct assessments. However, use of the model would have avoided the excision of almost half of those lesions. For a cutaneous melanoma to be diagnosed, identification of at least 1 major and 1 minor ELM criterion (or 3 minor criteria) was required. This confirmed the previously reported rule that a single criterion usually does not suffice to make a diagnosis [6].
More recently, Haenssle et al. have assessed the sensitivity, specificity, and diagnostic accuracy of the 7-Point Checklist in the setting of a prospective long-term study. They have screened patients at increased melanoma risk at regular intervals by naked-eye examination, the dermoscopic 7-point checklist, and digital dermoscopy follow-up (10-year study interval). They have detected 127 melanomas including 50 melanomas in situ. The mean Breslow thickness of invasive melanomas has been 0.57 mm. A total of 79 melanomas were detected using the 7-point checklist melanoma threshold of 3 or more points (62 % sensitivity, compared with 78–95 % in retrospective settings). In all, 48 melanomas have scored fewer than 3 points and have been excised because of complementary information (e.g., lesional history, dynamic changes detected by digital dermoscopy). The specificity of the 7-point checklist has been 97 % (compared with 65–87 % in retrospective settings). Regression patterns, atypical vascular patterns, and radial streaming have been associated with the highest relative risk for melanoma (odds ratio 3.26, 95 % confidence interval 2.05–5.16; odds ratio 3.04, 95 % confidence interval 1.70–5.46; odds ratio 2.91, 95 % confidence interval 1.64–5.15; P  0.0003, respectively). Melanomas thicker than 0.5 mm have exhibited significantly more regression patterns and atypical vascular patterns (P
  0.02). The malignant versus benign ratio for all excised lesions has been 1:8.6 (127 melanomas, 1092 non-melanomas). As a consequence, the 7-point checklist has appeared less sensitive but highly specific in this prospective clinical setting. Complementary information has clearly increased sensitivity. Thus, the authors have suggested that regression patterns or radial streaming in nevi of patients at high risk should raise a higher melanoma suspicion than might be concluded from retrospective studies [7].
0.0003, respectively). Melanomas thicker than 0.5 mm have exhibited significantly more regression patterns and atypical vascular patterns (P 0.02). The malignant versus benign ratio for all excised lesions has been 1:8.6 (127 melanomas, 1092 non-melanomas). As a consequence, the 7-point checklist has appeared less sensitive but highly specific in this prospective clinical setting. Complementary information has clearly increased sensitivity. Thus, the authors have suggested that regression patterns or radial streaming in nevi of patients at high risk should raise a higher melanoma suspicion than might be concluded from retrospective studies [7].Further studies have proposed the use of simplified diagnostic algorithms, such as 3-point. Firstly Soyer et al. have evaluated the diagnostic performance of non-experts using a new 3-point checklist based on a simplified dermoscopic pattern analysis. Clinical and dermoscopic images of 231 clinically equivocal and histopathologically proven pigmented skin lesions were examined by 6 non-experts and 1 expert in dermoscopy. For each lesion the non-experts assessed 3 dermoscopic criteria (asymmetry, atypical network and blue-whitish veil) constituting the 3-point method. In addition, all examiners made an overall diagnosis by using standard pattern analysis of dermoscopy. Asymmetry, atypical network and blue-white structures were shown to be reproducible dermoscopic criteria, with a kappa value ranging from 0.52 to 0.55. When making the overall diagnosis, the expert had 89.6 % sensitivity for malignant lesions (tested on 68 melanomas and 9 pigmented basal cell carcinomas), compared to 69.7 % sensitivity achieved by the non-experts. Remarkably, the sensitivity of the non-experts using the 3-point checklist reached 96.3 %. The specificity of the expert using overall diagnosis was 94.2 % compared to 82.8 and 32.8 % achieved by the non-experts using overall diagnosis and 3-point checklist, respectively. These data showed that the 3-point checklist can be considered a valid and reproducible dermoscopic algorithm with high sensitivity for the diagnosis of melanoma in the hands of non-experts. Thus, the authors suggested that the 3-point checklist might be applied as a screening procedure for the early detection of melanoma [8]. Afterwards, Zalaudek et al. revaluated these preliminary results in a large number of observers independently from their expertise in dermoscopy. The three-point checklist showed good interobserver reproducibility (kappa value: 0.53). Sensitivity for skin cancer (melanoma and basal cell carcinoma) was 91.0 % and this value remained basically uninfluenced by the observers’ professional profile. These results confirmed that the three-point checklist was a feasible, simple, accurate and reproducible skin cancer screening tool [9].
In 2010, Gerely et al. compared the sensitivity, specificity, and diagnostic accuracy of the seven-point and three-point checklist methods in the diagnosis of clinically atypical pigmented skin lesions and melanoma. The sensitivity, specificity, and positive and negative predictive values of the seven-point checklist method were 87.50, 16.17, 51.22, and 57.14 %, respectively. The sensitivity, specificity, and positive and negative predictive values of the three-point checklist method were 89.58, 31.25, 56.58, and 75 %, respectively. Thus, this study highlighted that the three-point checklist was observed to be a superior screening test. The seven-point checklist provided a more detailed analysis, especially for thin melanomas. In comparison with the seven-point method, the three-point method may be useful for less experienced observers when they need to obtain greater diagnostic accuracy [10].
However, it has been demonstrated that the 7-point checklist and the other above-cited diagnostic algorithms have actually a lower diagnostic accuracy if they are performed by inexperienced dermatologists [11]. Dermoscopy requires high training to optimize diagnosis of pigmented skin lesions. Indeed, Binder et al. demonstrated that ELM pattern analysis increases the quality of diagnostic performance of ELM experts but decreases the performance of clinicians not specially trained in ELM [12].
To avoid these problems, to enhance the reproducibility of clinical diagnosis and to help clinicians with poor dermoscopic experience, computer-assisted analysis of dermoscopic images has been investigated. Computer-aided diagnosis can help clinicians in the diagnosis of skin lesions. The aim of these systems is to increase the specificity and the sensitivity in melanoma recognition and reduce unnecessary biopsies. Most of these automated systems are based on the afore-mentioned melanoma diagnosis methods. In general, image processing techniques are used to locate the lesions, extract image parameters describing the dermatological features of the lesions, and, based on these parameters, perform the diagnosis. Their potential benefits are very promising, but there are considerable difficulties involved in their development and their use in clinical practice. It has been widely stated that their accuracy can achieve the same range as dermoscopic diagnosis performed by experts or even that they can obtain better accuracy [13]. Computer-aided diagnosis, based on mathematical analysis of pigmented skin lesions, can be a tool to transform a qualitative evaluation into a quantitative one and to increase sensitivity of dermatologists with low dermoscopic experience. Suggest clinicians step by step the dermoscopic criteria arising from observation can mean to implement the dermoscopy use without reduce its diagnostic accuracy.
Automatic Diagnostic Systems
As previously introduced, there has been much research aimed at obtaining an improved and consistent differentiation between benign and malignant melanocytic skin lesions by means of digital dermoscopy analysis. Computerized dermoscopy image analysis, in fact, adds a quantitative evaluation to the “clinical eye observation” and can be used to improve biopsy decision-making [14].
Therefore, different groups have been developing diagnostic systems of recorded images (slides or digital cameras) techniques to assist clinicians in differentiating early melanoma from benign skin lesions [15].
For example, in [16] an automated melanoma recognition system is proposed taking into account 21 parameters extracted from images.
Schmid [17] proposed a color based segmentation scheme without extracting features, whereas a new procedure based on the Catmull-Rom spline method and the computation of the gray-level gradient of points extracted by interpolation of normal direction on spline points was employed in [18].
A computer algorithm for the diagnosis of melanocytic lesions based on the evaluation of 64 different analytical parameters is described in [19], whereas a software module which automatically evaluates the outline of a lesion providing 50 objective parameters subdivided into three categories (geometries, texture and coloured islands) is developed in [14].
Very interesting summaries of the main researches about the digital dermoscopy (in terms of acquisition, calibration, image datasets and processing methods) are reported in [20, 21]. As a results of these surveys, high accuracy may be achieved by computer aided diagnostic systems employing statistics obtained from low-level features and parameters. Nevertheless, it is not likely that the digital system will completely substitute the expert in dermoscopy.
The Proposed Framework
According to the author’s opinion, the automated system should be in fact integrated by higher level features based on a particular diagnostic scheme in order to gain greater clinical acceptance.
More precisely, the software diagnostic system should be able to reproduce the expertise of a well-trained dermatologist and support the clinician in his/her visual inspection and diagnosis according to well-known dermoscopic methods. In detail, three different diagnostic models have become more widely accepted by clinicians for the interpretation of the features inspected by dermoscopy.
Starting from the previous considerations, the authors have tackled the problem of defining suitable image processing algorithms for the automatic implementation of the 7-Point Checklist.
A preliminary study about the image processing techniques for the extraction of the pigmented lesion (from healthy skin) and the detection of chromatic features was reported in [22].
Further studies [23, 24] have led to the introduction of a software framework [25] for the automatic detection of dermoscopic criteria. Following the example of the Computer Aided System architecture proposed for digital ELM images by Schmid [26] and the methodological approach to the classification suggested in [27], the software framework includes all the processing algorithms derived from the clinical knowledge gained by expert dermatologists (well-trained in the 7-Point Checklist application).
In [28] a statistical approach is introduced for the automatic detection of a minor criterion (Irregular dots/globules).
The present chapter reviews the main image processing techniques adopted to provide and improve the diagnostic capability of the automatic tool which implements the 7-Point Check-List. Basic software tasks such as feature identification and high-level classification are deeply investigated with respect to multiple dermoscopic structures. Finally, the experimental results are extended to a large set of pigmented lesion and a comparison among the different techniques is also carried out.
Methods
According to the scheme reported in Fig. 2, the software procedure developed for the automatic analysis and diagnosis of dermoscopic images is organized into three main detection stages.
After a preliminary processing stage designed to remove hair and/or artifacts, the Boundary Detection (I) allows the pigmented lesion to be extracted from the surrounding healthy skin. Then, the Low-Level Structure Detection (II) aims to identify and measure the main morphological and chromatic features throughout the lesion. Finally, at Dermoscopic Structure Detection (III), the feature classification and analysis are performed in order to detect each ELM criterion (high-level structure) provided by the 7-Point Checklist.
In the following subsections, for each stage of the automated procedure the remarkable literature is reviewed as well as the authors’ novel approach is detailed in terms of advanced statistical techniques.
Fig. 2
Scheme of the software framework for the automatic diagnosis of ELM images
Pre-processing
Lesion segmentation in the presence of hair is usually doomed to failure. Because shaving the lesion area before the acquisition often interferes with the clinical practice, a computer-aided system for the analysis of dermoscopic images should always include an automated hair removal algorithm.
A well known hair removal algorithm was proposed in [29]: it identifies the image segments that approximate the structure of the hair, and then the regions that contain these segments are interpolated using the information of the surrounding pixels. A similar approach is proposed by Schmid in [30], concerned with uniform color spaces, such as L*u*v* (the main advantage is that color difference can be measured and used for comparisons between pixels or distance measures in the spectral domain). According to the latter approach the morphological closing operator with a spherical structuring element is applied to the luminance component L*, then the threshold operation is carried on the difference with the original image. More sophisticated techniques [31, 32] have also been introduced using image inpainting. Nevertheless, similar results are achievable. Thus, the algorithm disclosed in [30] has been preferred as preliminary stage in the proposed framework.
Boundary Detection
Boundary detection is a critical problem in ELM images because the transition between the lesion and the surrounding skin is smooth and hard to detect accurately, even for a trained dermatologist. Consequently, different approaches [33] have been developed for automatic detection of lesion border in both clinical and dermoscopy images.
Many studies have introduced techniques based on color clustering [17, 34–36]. For example, in [17] the first two principal components of the CIE L*u*v* color space are adopted to determine a 2D histogram. Then, initial cluster centers are calculated from the peaks using a perceptron classifier and, finally, the lesion image is segmented using a modified version of the fuzzy c-means (FCM) clustering algorithm. Other color clustering algorithms provide for median cut, k-means, FCM and meanshift [37]. Further approaches investigating on digital lesion images include snakes methods based on gradient vector flow [38, 39], improved region-based active contour algorithms [40], morphological flooding [30] and optimized JESG segmentation [41]. Finally, the Histogram Thresholding represents a widely-adopted strategy, upon which the latest investigations have been focused by introducing color channel optimization, hybrid (i.e. combined global and local) thresholding [42], and/or fusion within Markov Random Field framework [43].
A very interesting comparison of the main proposed approaches is reported in [44], where a new algorithm based on Statistical Region Merging (SRM) is also introduced. As results of this survey, two approached emerged as the most effective methods: SRM and DTEA (Dermatologist-like Tumor Extraction Algorithm, [45]).
The Statistical Region Merging is a recent technique [46] belonging to the region growing and merging group. The method models segmentation as an inference problem, in which the image is treated as an observed instance I of an unknown theoretical image I*, whose statistical (true) regions are to be determined. This method is typically adopted for its simplicity, computational efficiency, and excellent performance without the use of quantization or color space transformations. Specifically, each pixel of the true image I* can be modeled as a set of Q independent random variables whereas the statistical regions represent theoretical objects sharing a common homogeneity property:
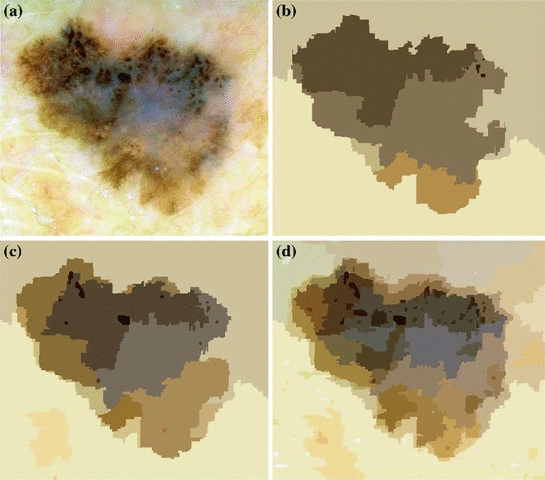
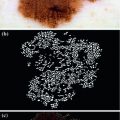
Given the homogeneity property the ideal segmentation of the observed image I relies on the frontiers between the statistical regions which are connecting pixels with differences in their color expectation. Figure 3 depicts an example of color segmentation for the ELM image performed through the SRM: each region is displayed according to its mean RGB values (averaged on pixels constituting the region). The parameter Q allows to quantify the statistical complexity of I*, the generality of the model and finally control the coarseness of the segmentation.
inside any statistical region the pixels have the same expectation for each color channel (for example Red, Green and Blue);
the expectation of adjacent regions are different for at least one color channel.
Fig. 3
Segmentation using statistical region merging: a ELM image; b results for  ; c results for
  ; d results for
; c results for ; d results for Thus, the lesion map resulting from SRM segmentation can be further investigated in order to detect the inner regions constituting the pigmented lesion to be contoured. According to the method suggested in [44], the background skin color is estimated as mean R, G and B colors of the pixels belonging to four patches ( sized) from the corners of the image. Post-processing provides for the deletion of light-colored and bounding regions (including the regions whose mean color has an Euclidean distance less than 60 to the background skin color, the regions that touch the image frame and those with rectangular borders). The initial border detection result is obtained by removing the isolated regions and then merging the remaining regions. Finally a morphological dilation with a circular structuring element is applied to obtain the automatic border.
sized) from the corners of the image. Post-processing provides for the deletion of light-colored and bounding regions (including the regions whose mean color has an Euclidean distance less than 60 to the background skin color, the regions that touch the image frame and those with rectangular borders). The initial border detection result is obtained by removing the isolated regions and then merging the remaining regions. Finally a morphological dilation with a circular structuring element is applied to obtain the automatic border.The DTEA algorithm is based on thresholding followed by iterative region growing. Following the same approach, the authors suggested in [25] a novel lesion border detection. The developed algorithm, referred to as Adaptive Thresholding, consists of three steps:
In the first step, 3 different monochrome images are obtained from the source image (RGB standard color) corresponding to the red, green and blue planes. For each component (see Fig. 4a), two modes (classes) are typically evident in the pixel intensity histogram (as depicted in Fig. 4b) corresponding respectively to the pigmented lesion (the image foreground) and the surrounding skin (the image background). Then, the algorithm introduced by Otsu [47] is adopted to select the optimum threshold S* for each histogram, thus allowing the image background and foreground to be detected. The adaptive algorithm aims to minimize the intra-class variance  :
:
i.
color to monochrome image conversion;
ii.
image binarization using an adaptive threshold;
iii.
border identification, based on a blob-finding algorithm.
:
(1)
defined as a weighted sum of variances  of the two intensity classes
  resulting from the S threshold:
of the two intensity classes resulting from the S threshold:
(2)
where  is the probability distribution, N is the number of the image pixels, L is the number of histogram bins and
  the number of pixels associated with k intensity value.
is the probability distribution, N is the number of the image pixels, L is the number of histogram bins and the number of pixels associated with k intensity value.Fig. 4
Example of boundary detection: a image conversion (Red, Green, Blue planes); b intensity histogram; c binary mask; d lesion contour
Otsu shows that minimizing the intra-class variance is the same as maximizing the between-class variance  :
:
:![$$\begin{aligned} \sigma ^{2} {}_{B}(S) = \sigma ^{2} - \sigma ^{2} {}_{W}(S) = P {}_{0}(S) P {}_{1}(S) [\mu _{0}(S) - \mu _{1}(S)]^{2} \end{aligned}$$](/wp-content/uploads/2017/02/A306585_1_En_4_Chapter_Equ3.gif)
(3)
which is expressed in terms of class probabilities  and class means
  (with
(with  ).
).
and class means (with ).The adoption of the Otsu’s method to RGB color image leads to three histograms and potentially different thresholds values. Since the proposed approach has been experimentally revealed to be more sensitive to surrounding skin (the image background), the largest binary mask (the image foreground) is considered for next processing. An example of result is shown in Fig. 4c.
Finally, a simple blob-finding algorithm is adopted to extract the contour of the lesion from the binary mask. According to the modified version of Moore’s Neighbor Contour Tracing proposed in [48], the tracking algorithm collects and sorts the contour lines (single pixel width) of the binary mask into an ordered list (the adopted algorithm also reveals to be computationally efficient by deleting the stopping criterion concerned with the start pixel). At this point, the border is superimposed on the color ELM image and displayed for visual inspection to the diagnostician (Fig. 4d).
Low Level Structure Detection
The dermoscopic criteria as defined by 7-Point Checklist Method are characterized both by chromatic and morphological low level structures (features). Thus, once the lesion is localized, feature extraction is performed by adopting suitable statistical techniques, which may be grouped into the following macro-categories:
color segmentation
texture analysis
Fig. 5
Color segmentation based on Multi-thresholding: a 1st principal component; b 2nd principal component; c 3rd principal component; d joint histogram of the first 2 principle components; e down-sampled 2-D histogram; f result of peak-picking method; g partitioned 2-D histogram; h ELM image and lesion contour; i lesion map
Color Segmentation
Starting from the source image and the binary mask, the color segmentation stage is carried out with the aim of splitting the internal area into multiple chromatically homogenous regions (the lesion map).
To this aim, the SRM algorithm previously introduced may be adopted, by regulating the coarseness through a suitable choice of the Q parameter.
An alternative approach, proposed in [49] and investigated by the authors for dermoscopic images in [25], is represented by the Multi-Thresholding of the color image. In particular the following steps are proposed: (i) Principal Component Analysis (PCA); (ii) 2D histogram construction; (iii) peaks picking algorithm; (iv) histogram partitioning; (v) lesion partitioning.
(i) The Principal Component Analysis (also known as the discrete Karhunen-Loeve Transform or Hotelling Transform [50]) is a technique for reducing the dataset dimensionality while retaining those characteristics that contribute most to dataset variance. As for the application of the Principal Component Analysis to the ELM image, the RGB components of the pixels corresponding to lesion area (selected trough the binary mask obtained as final result of image segmentation) constitute the starting dataset (belonging to a state space with dimension  ). A new 3D representation of the lesion pixels can be obtained from the Hotelling Transform equation. An example is reported in Fig. 5a–c: the decreasing variability in each individual band as long as the order of the principal component increases can be noted easily (for more evidence, PCA is related to all image pixels taking into account also the surrounding skin).
). A new 3D representation of the lesion pixels can be obtained from the Hotelling Transform equation. An example is reported in Fig. 5a–c: the decreasing variability in each individual band as long as the order of the principal component increases can be noted easily (for more evidence, PCA is related to all image pixels taking into account also the surrounding skin).(ii) Since the low order components preserve sufficient information in order to obtain reliable information (Fig. 5a, b) whereas the third component contains most of the image noise (Fig. 5c), a joint histogram is created from the first 2 principle components (referring to which the multithresholding has to be carried out). An example of 2-D histogram is depicted in Fig. 5d. Because the estimated histograms are, in general, noisy due to the scarcity of data, it is advantageous to smooth and down-sample the histograms to eliminate noise effects. In particular the original histogram is reduced from size  to size
  (see Fig. 5e).
to size (see Fig. 5e).(iii) The multithresholding is carried out by finding peaks in the 2-D histogram with significant mass around them. It is expected that these peaks will correspond to the cluster centroids in 2-D space and consequently will be well-representative of corresponding color regions (or segments) in the starting image. The knowledge of the number of segments is implicit in the peak search, and so is the maximum number K of peaks which have to be determined in the 2-D histogram. In our application the algorithm of Koonty [51] has been considered as peaks-picking method. As an example, in Fig. 5f the result of the peaks-picking algorithm is depicted with reference to the 2-D histogram shown in Fig. 5e when K equal to 10 is selected as maximum number of different color regions.
Related posts:
 Network Detection and Analysis
Stay updated, free articles. Join our Telegram channel

Full access? Get Clinical Tree


