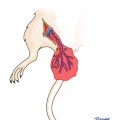
Fig. 53.1
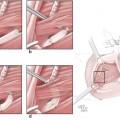
(a–d) The technique of sleeve nerve repair. (a) The epineural sheath of one of the nerve graft endings was dissected and pulled back 2 mm distally. (b) Protruding fascicles were trimmed (2 mm). Two sutures were passed through the coaptation site and at 180° apart. (c) The epineural sleeve was then pulled over proximally covering the site of coaptation. (d) Two additional epineural sutures were placed at the edge of the sleeve away from the coaptation site to secure the graft
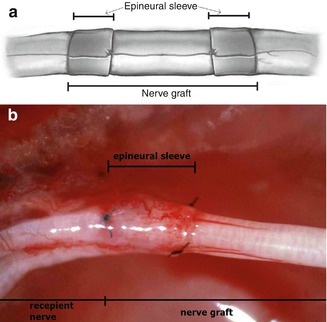
Fig. 53.2
Epineural sleeve technique in nerve graft (ESN group). Epineural sleeve is created from both recipient nerve stumps (a). Proximal coaptation site (b)
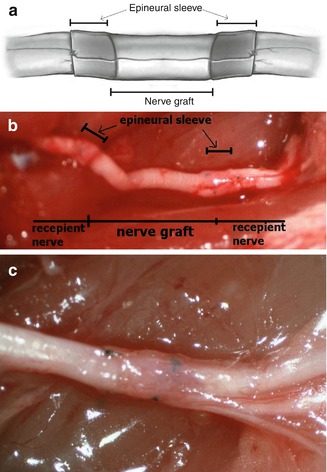
Fig. 53.3
Epineural sleeve technique in nerve graft (ESG group). Epineural sleeve is created from both nerve graft ends (a, b). Distal coaptation site (c)
Experimental Study on Epineural Sleeve Technique for Nerve Graft
In order to investigate the efficacy of epineural sleeve technique we have run experimental study. The purpose of the study was evaluation of nerve recovery following epineural sleeve technique for graft reconstruction in rat sciatic nerve. The results have been published in 2008 in Microsurgery [13]. The study has been also awarded during Annual Meeting of American Society for Surgery of the Hand in 2001, judged to have “the greatest future clinical application to the practice of hand surgery.”
Materials and Methods
Twenty-four Lewis rats were divided into three groups of eight rats each. In Group I (Conventional Nerve Graft= CNG), nerve grafting using conventional epineural repair with four sutures at each site was performed. In the epineural sleeve technique, a segment of epineurium from the nerve (or graft) stump is dissected as a sleeve into which the opposite nerve (or graft) stump is inserted. The sleeve is then anchored with two epineural sutures at the site 180° apart. In Group II (Epineural Sleeve Graft= ESG), a sleeve was created from the graft epineurium and was pulled to cover the both stumps of recipient nerve. In Group III (Epineural Sleeve Nerve= ESN), a sleeve was created from both proximal and distal sciatic nerve stumps and was pulled over to cover the nerve graft ends.
Technique of Conventional Epineural Repair
The nerve graft was implanted using epineural suture according to standard technique on both sites of the nerve graft coaptation. Four epineural sutures were placed at 90° apart. For both ESG and ESN group techniques were applied as described earlier. After operation, the animals were allowed to walk freely in cages (one per cage).
Functional and Morphological Evaluation of Nerve Recovery
Nerve regeneration in each rat was evaluated at 3, 6, 12 and 24 weeks by pin-prick sensation; toe-spread, and walking track analysis. At 12 and 24 weeks, somatosensory-evoked potentials (SEP) were measured. Gastrocnemius muscle weight was measured and histomorphometric nerve studies performed. Nerve samples were harvested and stained with toluidine blue staining for histological evaluation. Using the computerized digital system, the total number of myelinated axons, axon diameter, as well as myelin sheath thickness, was calculated.
Pinprick Test
This test was used to assess the recovery of sensory function. The response was graded on a 0–3 point scale. Withdrawal reaction was marked “0” when absent during skin stimulation. One point was given for sensation above the knee level; two points at the level between the knee and ankle, and three points distal to the ankle.
Toe-Spread Test
Toe-spread was used to assess motor function recovery. Toe-spread was evaluated by raising the animal by the tail and observing voluntary reaction of the toes. Normal reaction was assigned when full toe extension and abduction was observed. For evaluation of nerve recovery, a scale of 0–3 was applied. No reaction was given 0 points. Any sign of toe movement was awarded one point, abduction, two points, and extension, three points.
Walking Track Analysis
Walking track was used as another measure for motor recovery assessment. The hindfeet of both animals were dipped in black ink. The animals were then allowed to walk the track which was lined with paper. Footprints were taken for analysis which was performed according to the method by Bain et al. [14]. Print length (PL), toe spread (TS), and intermediary toe spread (ITS) of the normal and experimental foot were measured. The sciatic function index (SFI) was calculated according to formula described previously [14].
Somatosensory-Evoked Potentials (SEP)
Somatosensory-evoked potentials were evaluated by using the Bio-logic A-PAC 486 microcomputer (Bio-logic Systems; Chicago, IL). For SEPs, stimulating electrodes were placed subcutaneously at foot level at the site of sciatic nerve repair. Next two holes were drilled in parietal bones of the cranium to place recording electrodes over the area of somatosensory cortex. Constant electrical stimulus (10–30 mA/200 μs) was applied over the sciatic nerve distribution in foot. At least 300 average responses were collected to produce one waveform. No less than three waveforms were recorded for each animal follow-up and two most consistent waveforms were considered for further evaluation. Typically triphasic waveform was registered with characteristic latencies and a series of negative and positive potentials. P1 (first positive) and N2 (first negative) latencies were taken into consideration and measured as the most consistent ones. The final result was the average of P1 and N2 values calculated from two retained waveforms.
Muscle Weight
Muscle weight to assess denervation atrophy was measured at 12 weeks follow-up. The gastrocnemius muscle was excised from the lower leg and muscle weight was measured immediately. Wet weight of the ipsilateral muscle was related to the contralateral gastrocnemius and muscle weight index was calculated.
Histomorphometry
Histomorphometric analysis was performed following harvest of the sciatic nerves. Sections were taken proximally to nerve graft, in the middle of the graft and distally to the graft. Harvested nerves were fixed in glutaraldehyde and stained with toluidine blue. Images were observed at 1,000× magnification. Six random images per nerve crossection measuring 203.2 × 15.24 μm were acquired by digital camera (Kodak DC-100). Images were further analyzed by Image Pro Plus Software ver. 4.1.0.0, (Media Cybernetics, L.P.). Number of myelinated axons per mm2 (axon density), axon diameters and myelin sheath thickness were counted and calculated with software support.
The Mann-Whitney test and t-student was used to determine statistical significance. P values of less then 0.05 were considered as significant.
Results
Pinprick Test
At 3 weeks, an average pin-prick was at the level above the ankle. After 6 weeks, the pin-prick test was positive at the level of the foot and toes reaching its maximum values. Detailed values are depicted on Fig. 53.4. There were no statistical differences between the groups.
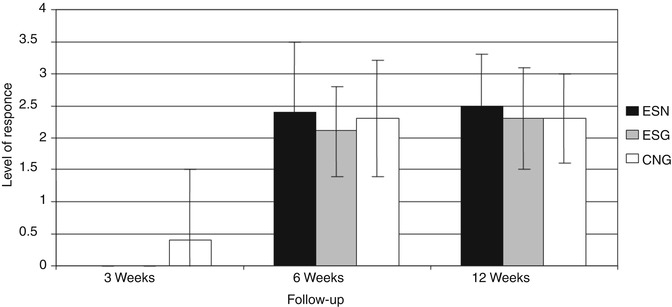
Fig. 53.4
Results of pinprick test at 3, 6 and 12 weeks after grafting. Groups: ESN- sleeve from recipient nerve, ESG- sleeve from the graft, CNG- nerve graft with standard coaptation
Toe-Spread Test
At 3 weeks follow up, no return of motor function could be noted in any of groups. Results improved at 6 weeks. On average, toe extension was present with some degree of abduction. No further improvement could be detected at 12 weeks. There were no statistical differences between animals from different groups. Results are presented in Fig. 53.5.
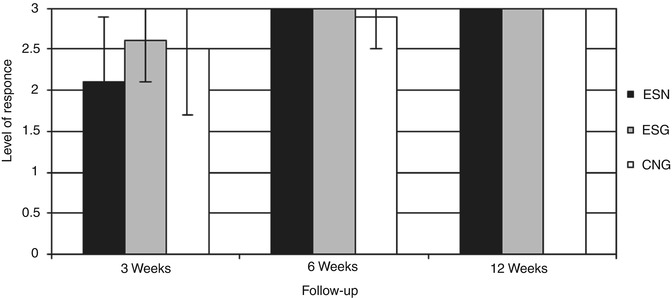
Fig. 53.5
Results of toe-spread test. Groups at 3, 6 and 12 weeks after grafting: ESN sleeve from recipient nerve, ESG sleeve from the graft, CNG nerve graft with standard coaptation
Walking Track Analysis
The average sciatic function index calculated from walking track analysis at 3 weeks did not reveal significant differences among the experimental and control groups (ESG- −87.7 ± 13.4; ESN- −85.5 ± 6.5; CNG- −88.8 ± 10.1). At 6 weeks, however, significantly better recovery was observed in the ESN group (−56.3 ± 15.2) compared to the control-CNG group (−76.4 ± 16) and the ESG group (−73.5 ± 5) (p < 0.05). At 12 weeks, only the ESG group revealed further improvement (−59.81 ± 4.2). The ESN group did not change (−60.7 ± 6.7) and was still significantly better than the CNG group (CNG- −81.86 ± 7) (p < 0.05). Detailed results of the SFI are depicted in Fig. 53.6.
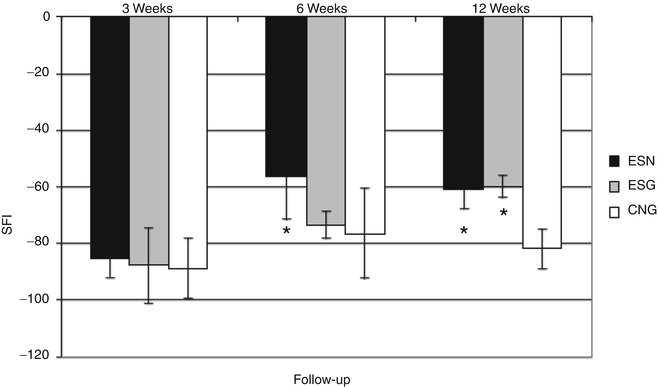
Fig. 53.6
Results of walking track analysis at 3, 6 and 12 weeks after grafting. Groups: ESN sleeve from recipient nerve, ESG sleeve from the graft, CNG nerve graft with standard coaptation, * statistically significant difference at p < 0.05
Somatosensory Evoked Potentials (SEP)
At the same time, results of SEPs proved better sensory recovery for the ESN group, represented by shortened latency values of P1 (12.31 ± 1.84 ms) and N2 (17.35 ± 2.4 ms) when compared to the ESG (P1- 15.71 ± 2.45 ms; N2- 21.3 ± 2.38 ms) and CNG (P1- 14.12 ± 1.88 ms; N2- 20.71 ± 1.34 ms) groups (p < 0.05) at weeks. Differences continued to be significant also at 24 week follow-up. Detailed results and statistical significance SEPs are depicted in Fig. 53.7.
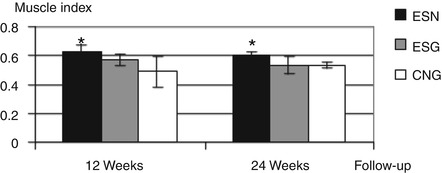
Fig. 53.7
Results of muscle weight index at 12 and 24 weeks after grafting; groups: ESN sleeve from recipient nerve, ESG sleeve from the graft, CNG nerve graft with standard coaptation, * statistically significant difference at p < 0.05
Muscle Weight
Related posts:
 Microcirculation Model for Invasive Animal Monitoring
 Composite Osseomusculocutaneous Thymus Allotransplantation Model
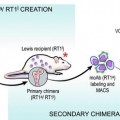 In Vivo Chimera Model: Creation of Primary and Secondary Chimera
 Experimental Model for Monitoring of Composite Tissue Transplantation Induced Trauma
 Neuroma Model
 Defect Repairs After Resections of Laryngeal Cancer, Hypopharyngeal Cancer, and Cervical Esophageal Cancer
Stay updated, free articles. Join our Telegram channel

Full access? Get Clinical Tree


