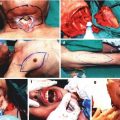
Fig. 10.1
This figure shows invasive procedures performed at the beginning of the experiment to monitor vital parameters (described in text). Animals were anaesthetized, intubated and ventilated. ECG was recorded using pin electrodes with a lead II configuration. The left femoral artery, left femoral vein, left jugular vein and right common carotid artery were isolated and cannulated. The left femoral artery and the left femoral vein were cannulated to measure MAP and to supplement water and electrolytes. The central venous pressure was measured in the left jugular vein, and blood was collected for gasometric analysis from the right common carotid artery. The cremaster muscle was isolated from the neuro-vascular pedicle as a free muscle flap
Depending on the type of the tested anesthetic agent, anesthesia was maintained by:
The cremaster muscle was isolated from the neuro-vascular pedicle as a free muscle flap according to the technique by Siemionow. During this surgical procedure the genito-femoral nerve, also responsible for the autonomic innervation of the cremaster muscle, was coagulated first along a one centimetre section and then cut, to completely denervate the investigated muscle [22].
The investigation and observations were made using a Nikon Optiphot-2 microscope equipped with standard lenses. The microscope was connected to a video camera, and at the same time coupled with a Doppler flow meter for red blood cells, and a processor measuring the flow velocity. The obtained image of the microcirculation was displayed on a TV monitor, where the final magnification of the microscopic image was ×1,800 [27–29].
Real-time measurements of the following microcirculation parameters were taken (Fig. 10.2):
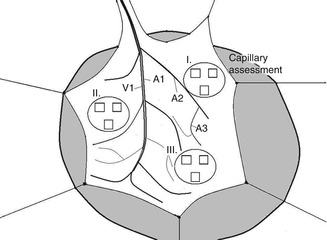
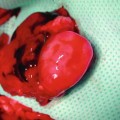
Fig. 10.2
This figure show cremaster muscle flap spread on the tissue bath, prepared for direct in vivo monitoring of microcirculation. Four distinct blood vessels were selected for analysis (mean vessel diameter and RBC velocity): A1 first-order arteriole; A2 second-order arterioles; A3 third-order arterioles; and V1, first-order venule). Functional capillary density assessment was performed in nine high-power fields (black rectangles) in the area of three preselected postcapillary venules in proximal (I), middle (II), and distal part (III) of the flap for total tissue surface area of 0.18 mm2
1.
The diameter of A1, A2-1, A2-2, and A3 arterioles, and V1 venula.
2.
Flow velocity of red blood cells in A1, A2-1, A2-2, A3 arterioles and V1 venula.
3.
The behaviour of leukocytes and lymphocytes in the postcapillary venula. We counted leukocytes and lymphocytes rolling through the lumen of the postcapillary venula, leukocytes and lymphocytes adhering to the vascular endothelium, and leukocytes and lymphocytes outside the lumen of the postcapillary venula.
4.
Endothelial oedema index in the postcapillary venula (ratio of inner vessel diameter to its outer diameter).
5.
The number of capillary vessels with blood flow in a precisely selected area of the cremaster muscle flap. This measurement was done in 27 fields of the cremaster muscle.
All measurements were taken within 4 h, at 1-h intervals, always at the same site of the investigated muscle. The number of leukocytes and lymphocytes rolling in the lumen of the postcapillary venula was counted for 2 min in 1-h intervals using a manual counter. A detailed description of the measured microcirculation parameters was presented in previous publications [23, 24].
The postcapillary venula plays a critical role in the physiology of the microcirculation. Processes that occur in it, such as the rolling of leukocytes and lymphocytes, their adhesion to the endothelium, transmigration through the wall into the extravascular space, the change in diameter of the venula, and endothelial edema are direct evidence of the influence of specific experimental conditions, and used drugs, including anesthetics, on the entire microcirculation of the investigated muscle.
To assess microvascular permeability, we administered 0.02 ml/kg body weight of fluorescent isocyanate (FITC) albumin into the femoral vein [30–32]. We assessed the postcapillary venula, without the collateral vessels of 20–35 μm in diameter. The observations were carried out immediately after the 4-h evaluation of hemodynamic parameters for 1 h with a Zeiss 20 T fluorescent microscope. FITC-albumin molecules become fluorescent when excited with a 460–490 nm light wavelength generated using optical filters from the light emitted by a mercury lamp. The fluorescence microscope was integrated with a recording device incorporating a camera, a PC video capture card and Studio DS software. The FITC albumin contained in the lumen of vessels was visualized as a white column against a black background. The transmigration of FITC albumin molecules through the vascular wall was visualized as a white streak on the outside of the vascular lumen. Images of vessels in fluorescence microscopy were archived in a computer and then analyzed using Image PRO-PLUS software. The vascular lumen area was marked and then analyzed as the intravascular space. On both sides of the vessel the outlined areas of the extravascular space were similar in size and shape. We calculated the average optical density of the analyzed areas, and then a ratio of the ISS to IVS as the endothelial permeability index (PI). A high PI, close to one, indicated high endothelial permeability and resulted from endothelial damage (Fig. 10.3).
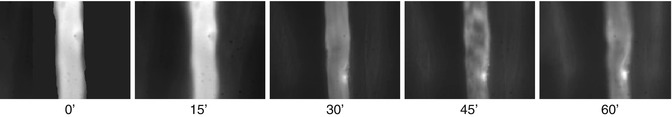
Fig. 10.3
Fluorescence microscopy. FITC-albumin molecules are visible in the postcapillary vessel lumen as light column. Transition of FITC-labeled albumin from the lumen into the extravascular space are visible as white streaks on both sides of the postcapillary venule. Images were performed at intervals of 15 min in a fifth hour of experiment. 0′-photo taken immediately after injection of FITC-albumin, 15′, 30′, 60′- pictures taken respectively at 15, 30, 45, and 60 min after injection of FITC-labeled albumin
Related posts:
 Lymphaticovenous Anastomosis Training Model in Rat
 Epineural Sleeve End-to-End Repair
 Somatosensory Evoked Potential Model for Assessment of Nerve Regeneration
 Peripheral Nerve Surgery Models Crush Injury and Epineural Patch
 Heterotopic Vascularized Ovarian Autotransplantation Model in the Sheep
 Defect Repairs After Resections of Laryngeal Cancer, Hypopharyngeal Cancer, and Cervical Esophageal Cancer
Stay updated, free articles. Join our Telegram channel

Full access? Get Clinical Tree


