Raman frequency (cm−1)
Assignment
526
ν(S–S)
600
ρ(C–H)
623
ν(C = S)
644
ν(C = S); amide IV
746
ρ(CH2) in phase
827
δ(CCH) aliphatic
850
δ(CCH) aromatic
883
ρ(CH2); ν(C–C); ν(C–N)
931
ρ(CH3) terminal; ν(C–C) of proteins α-helix
956
ρ(CH3); δ(CCH) alkenic
1002
ν(C–C) aromatic ring
1031
ν(C–C) skeletal cis conformation
1062
ν(C–C) skeletal trans conformation
1082
ν(C–C) skeletal random conformation
1126
ν(C–C) skeletal trans conformation
1155
ν(C–C); δ(COH)
1172
ν(C–C)
1244
δ(CH2) wagging; ν(C–N) amide III disordered
1274
ν(C–N); δ(NH) amide III of proteins α-helix
1296
δ(CH2)
1336
Not assigned
1385
δ(CH3) symmetric
1421
δ(CH3)
1438
δ(CH2) scissoring
1552
δ(NH); ν(C–N) amide II
1585
ν(C = C) alkenic
1602
not assigned
1652
ν(C = O) amide I of proteins α-helix
1743
ν(C = O) amide I of lipids
1768
ν(COO)
2723
ν(C–H) aliphatic
2852
ν(C–H in CH2) symmetric
2883
ν(C–H in CH2) asymmetric
2931
ν(C–H in CH3) symmetric
2958
ν(C–H in CH3) asymmetric
3060
ν(C–H) alkenic
3280
ν(O–H) of H2O
The strong absorbance of water limits the application of IR spectroscopy to tissues containing water. Only thin samples can be analyzed in transmission mode, and small penetration depths are available in attenuated reflection mode. On the contrary, Raman absorbance of water is weak, and the frequency of the light can be chosen independently of the frequency range of the spectroscopic analysis. This is a definite advantage of a method relying on a scattering phenomenon. Therefore, the wavelength of the incident laser light for Raman analysis is selected such that the sample is transparent and there is no fluorescence that would disturb the analysis. In the modern equipment, several laser wavelengths are available (from green light to infrared) as excitation light to match the various sample properties. The depth of penetration in the sample can reach several 10 μm. Since visible light is used, a confocal optical microscope is associated for collecting 3D maps of Raman spectra with the spatial resolution of optical microscopy (0.2–0.5 μm in x,y plane; 0.5–1 μm in z-axis).
A definite advantage of CRM is its ability to provide spatially resolved concentration and molecular structure information about skin components (protein conformation, lipid organization) while keeping the sample intact. Analyses are possible in skin up to 100 μm depth. Measurements can be made in vitro on excised skin samples as well as in vivo.
The intensities of Raman bands are proportional to the concentration of species, so that quantitative analyses can be done (Tfayli et al. 2012a). A close selection of appropriate conditions is achieved to study the skin, especially the excitation wavelength of the laser source (Tfayli et al. 2012b). Various excitation wavelengths in the visible or near-IR (from 532 nm to 1064 nm) are available as commercial sources; they are safe regarding in vivo measurements. Wavelengths of 532, 633, and 785 nm were widely used to record Raman spectra inside the skin. This parameter affects the scattered Raman intensity, possible fluorescence background, and signal attenuation along skin depth (Tfayli et al. 2012b). The actual z-depth in the sample is different than the optical path length because of the different refractive indices of the skin layers. A correction factor of 20% is often applied to calculate the actual depth. The correction actually depends on the z-value; it is larger at deep locus of analysis (Xiao et al. 2004; Tfayli et al. 2008).
The conformational disorder of SC lipids was extensively studied using IR spectroscopy. Utilization of classical Raman spectroscopy may suffer a lack of sensitivity in the spectral regions of interest for lipid analysis. Different Raman spectral manifestations of conformational order of lipids can be drawn from experiments performed on thin films of lipids, such as in recent works in vitro on ceramide films prepared from seven classes and subclasses of ceramides (Tfayli et al. 2010, 2012c). For example, information on intra-chain conformational order is obtained from the bands of C-C skeletal optical mode and the band of the twisting mode of CH2 groups, whereas the CH2 scissoring and stretching modes reflect the lateral packing of the lipid molecules, and the amide I band is used to evaluate the strength of H-bonds (Tfayli et al. 2012c). In vivo determination of lipids’ ordering by Raman spectroscopy is much more difficult (Tfayli et al. 2012d).
There are several variants of classical Raman spectroscopy besides the spontaneous Raman scattering technique where the spectrum acquisition is a direct measurement of the scattered light. Surface-enhanced Raman scattering (SERS) shows enhanced intensity for molecules located in the vicinity of metal particles. The sensitivity improvement requires the deposition of metal nanoparticles at the surface of the sample. SERS allows a specific analysis of the species present at the sample surface. Resonance Raman spectroscopy provides a selective spectrum of a molecule with high sensitivity when the frequency of the laser light (of the Raman spectrometer) is tuned to a UV-VIS absorption band of the molecule. Coherent Raman spectroscopy (Min et al. 2011) relies on nonlinear effects of two-photon absorption. A resonance occurs when the frequency difference between the two lights matches the frequency of the molecular vibration. A signal-to-noise ratio enhancement by several orders of magnitude is achieved when the resonance condition is met. However, such resonance methods are not spectroscopic methods because a single Raman frequency is measured at once. Coherent anti-Stokes Raman scattering (CARS) (Evans and Xie 2008) and stimulated Raman scattering (SRS) (Downes and Elfick 2010; Slipchenko et al. 2010) are the two major techniques. Several improvements of these techniques were recently introduced in order to increase the sensitivity and decrease the nonresonant background by epi-detection (Li et al. 2005); high speed confocal microscopy data can be collected (Saar et al. 2010). Equipment for two-color microscopy has been designed (Lu et al. 2012). SRS appears more sensitive and accurate than CARS (Nandakumar et al. 2009; Freudiger et al. 2008). Such techniques allow time-resolved confocal microscopy measurements with high sensitivity at the selected vibration frequencies of the penetrant molecules. Determination of band shifts that are characteristic of interactions of penetrant molecules and skin components requires several measurements at different specific frequency and merging of all in a full spectrum. A recent SRS technique making use of modulation of excitation Raman frequencies and signal demodulation by Fourier transform allows acquisition of several Raman bands at the same time, and possibly parts of Raman spectra (Fu et al. 2012). SRS has been used for investigating the skin absorption of trans-retinol, DMSO, and propylene glycol (Freudiger et al. 2008; Saar et al. 2010, 2011).
The determination of the thickness of stratum corneum by CRM analysis of the water absorption band is shown as an illustration of the power of CRM. Figure 13.1 shows a typical series of Raman spectra measured at 6 depths inside an excised pig skin sample. The Raman spectra were collected at different depths from 0 μm to 20 μm, as indicated in the picture of the histological section of skin (right side of Fig. 13.1). The intensity of the stretching band of O-H bond of water, ν(OH) at 3280 cm−1, increases upon going deeper from the skin surface (left side of Fig. 13.1). A sharp increase of the Raman band occurs when passing from the SC to the viable epidermis because the viable epidermis contains much more water (~70%) than SC (an average value is 13%). The thickness of the SC can be easily measured by CRM in this way. However, quantitative analysis is not a straightforward reading of the spectra. Conversion of the Raman intensity into water concentration requires a calibration which has often been made using the CH3 band at 2935 cm−1 as a reference (Caspers et al. 2000).
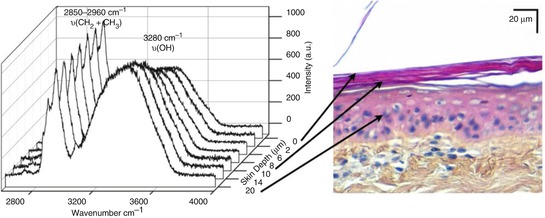
Fig. 13.1
In depth Raman profiles of untreated pig skin between 2800 and 4000 cm−1. At the right side, the histological image of the skin is illustrated with the arrows indicating skin depths (magnification ×40) (From Förster et al. (2011a), with permission)
13.3 Confocal Raman Microscopy for Studying the Mechanism of Action of Penetration Enhancers
The role of penetration enhancers to increase or modify the permeability of drugs through the skin has been thoroughly studied (William and Barry 2004; Benson 2005). However, fewer studies have been reported on the use of CRM for studying the mechanism by which penetration enhancers improve the penetration of different compounds. It is commonly accepted that penetration enhancers are able to alter the barrier properties of the SC by disrupting temporarily its structure. Several mechanisms have been proposed to explain their effect: lipid fluidization, lipid extraction, interaction with keratin, and pore formation (Benson 2005).
13.3.1 Water as Penetration Enhancer
Many chemicals show skin penetration enhancing properties. Well-known examples are Azone®, dimethylsulfoxide, alcohols, fatty acids such as oleic acid, surfactants, solvents, and terpenes. However, the first major penetration enhancer is water. The permeability of skin for hydrophilic molecules increases dramatically as skin is hydrated. Hydration by occlusion or exposition to high humidity level results in an increase of the SC water content from 13% (standard value) to near 400% of the dry tissue weight (Williams and Barry 2004). In the SC, the water can be bound to structural elements (natural moisturizing factor (NMF), functional groups) or free. The free water acts as a solvent for hydrophilic molecules in the SC, thus increasing the solubility of drugs in the tissue. Drug partition between the formulation and the SC is then modified, and the increase of solubility leads to higher transdermal fluxes of hydrophilic substances in hydrated skin. It is not clearly established whether water can enhance the skin penetration of lipophilic drugs. It has been proposed that swelling of the polar head group regions of the lipid bilayers by water could disrupt the lipid domains and cause higher permeability for lipophilic permeants such as steroids. However, several researchers have shown that water does not cause modification of the lipid bilayer packing (Bouwstra et al. 1991; Gay et al. 1994; Bouwstra et al. 1996; Bouwstra et al. 2003). van Hal et al. (1996) incubated human skin explants with a saline phosphate buffered solution for 24 h under occlusive or nonocclusive conditions. They proved that water penetrated in the corneocytes inducing their swelling, but also between the cells in the intercellular lipids region, mainly located in separated water pools. The images revealed these water pools and some vesicle-like structures occasionally found. However, the majority of the lipid bilayers exhibited a smooth fracture plane and no change in appearance. The amount of water in these smooth regions was low, and swelling of lamellae or lateral swelling of lipids was not observed.
Transepidermal water loss (TEWL) and electrical impedance (corneometry) measurements are two standard methods used in vivo to get information about the skin barrier integrity and the skin hydration level. Both methods are noninvasive and they can be considered as indirect measurements of the skin water content. CRM enables to monitor the water content in the tissue at various depths, enabling the water concentration profiles through the skin depth to be drawn (Caspers et al. 2000). The water content in the tissue can be determined from the ratio of Raman intensities of the OH stretch vibration of water at 3390 cm−1 and the CH3 stretch of protein at 2935 cm−1. To improve the signal-to-noise ratio, intensities were integrated from two bands (I OH: 3350–3550 cm−1 and I CH: 2910–2965 cm−1). Caspers et al. (2000, 2001) proposed a quantification method to determine absolute water content by calibration of the ratio of the abovementioned areas using spectra of concentrated aqueous solutions of proteins. The profiles of water content can also be used to estimate the SC thickness, as it is well known that the water content increases sharply at the separation surface between SC and viable epidermis from about 13% in the SC to 60–70% in the viable epidermis. Several analysis methods used to determine the water depth profiles were proposed to determine the boundary between SC and viable epidermis (Caspers et al. 2000, 2003; van der Pol et al. 2007; Crowther et al. 2008; Egawa and Kajikawa 2009; Darlenski et al. 2009; Hancewicz et al. 2012). The values of water content in SC reported by various authors are rather scattered, which is mainly due to the intrinsic variability of different types of skin samples (Hancewicz et al. 2012), variation with respect to body site (Egawa et al. 2007), whether the skin is dry or freshly hydrated (Egawa and Kajikawa 2009; Hancewicz et al. 2012), and also may come from different CRM data treatments. Raman microspectroscopy data correlated with values obtained from other methods such as Karl Fisher analysis (Wu and Polefka 2008) or optical coherence microscopy for evaluating SC thickness (Crowther et al. 2008). Based on the same methodology, NMF content and depth profiles of NMF can also be determined. CRM is a useful tool for the measurements of skin hydration levels, moisturizing product efficacy, and the influence of skin hydration on drug penetration enhancement. Egawa and Kajikawa (2009) addressed by using CRM the effect of skin hydration by measuring water profile after applying water or steam on the forearm of volunteers. The incubation time of the skin with water and the water temperature were varied to study the influence of these parameters on water profile changes. Water content in the SC increased with increasing the duration of water application from 1 to 10 min. Heating the applied water from 22 to 32 °C also resulted in an increase of the penetration depth, penetrated amount, and holding time of water. Furthermore, application water-steam increased the water content in the upper part of the SC. However, this study revealed an increase of the water content by comparing the water profile before and after water application, but it was not possible to differentiate the endogenous water from that penetrated in the skin. Direct measurement of water penetration in the skin by CRM requires replacing water of natural isotopic abundance by deuterated water D2O, which shows a Raman peak corresponding to the O-D stretching vibration at 2500 cm−1, different from endogenous water and clearly distinguishable in the spectra (Förster et al. 2011b). By applying emulsions and surfactant solutions made with deuterated water, Förster et al. showed that water penetrated from the formulations into the SC with a profile similar to that of endogenous water. However, no significant differences were observed between D2O ingress from all formulations, and no correlations could be found between water penetration and the penetration of trans-retinol present in the formulations.
Penetration of deuterated water in the SC after application of pure D2O on skin sample under occlusive conditions was recently confirmed by Ashtikara (2013).
13.3.2 DMSO as a Penetration Enhancer
Several studies aimed at explaining the penetration enhancement mechanism of dimethylsulfoxide (DMSO), one of the most common penetration enhancers. DMSO enhances the penetration of both hydrophilic and lipophilic drugs; its action in the skin is complex and remains largely an open question. Upon interaction with keratin, DMSO changes the keratin conformation, from α-helical to a β-sheet structure. DMSO can also interact with the polar head-groups of intercellular lipids, resulting in a perturbation of their packing. Finally, DMSO can alter the drug partition between the formulation and the skin layers due to its good solvent properties for a large number of molecules (Williams and Barry 2004).
Most studies on the behavior of SC lipids in skin have been carried out using IR spectroscopy. The poor signal-to-noise ratio in Raman spectroscopy has often limited its use for precise mechanistic investigation inside skin. Experiments using thin films of SC lipids allow devising what could be expected from measurements of skin. Tfayli et al. (2012c) studied the modification of the lipids’ conformational order, lateral packing, and polar interactions induced by three penetration enhancers. The Raman investigation was carried out on thin films of ceramides, the main lipid class of SC lipids, differing by their hydrocarbon chain length, polar head group, and the presence of a lateral group (ester or hydroxyl groups). The DMSO penetration enhancer affected mainly the polar interaction between lipid chains and the lateral packing of lipids, and its effect was dependent on the structure of the ceramides. For example, adding DMSO on ceramides IIIb resulted in the increase of the band at 1633 cm−1 indicating weak H-bonds at the expense of the Amide I band at 1614 cm−1 characteristic of strong H-bonds. DMSO also induced a slight change of the peak height ratio of the bands at 2850 cm−1 (νCH2 sym) and 2880 cm−1 (νCH2 asym) that reflected a looser lateral packing of all ceramides studied, indicating a decrease of compactness which could be associated with a higher permeability.
Finally, DMSO had a weak influence on the lipid chain conformations. Caspers et al. (2002) recorded the distribution of DMSO in the SC by CRM after application of an 80/20 mixture of DMSO and a 5% aqueous solution of propylene glycol. The mixture presented some characteristic bands, a doublet at 671 and 702 cm−1 assigned to the ν(CSC) modes and a broad band at 1030–1048 cm−1 assigned to ν(S = O) stretching. After application to the skin of volunteers, there was a shift of these bands, indicating the interaction of DMSO with water and possibly other components of SC. The SC depth profile was calculated as a function of time from the ratio of DMSO/proteins bands (ν(CSC)677 cm−1/δ(CH2)1450 cm−1). They showed that most of the applied DMSO permeated through SC within 20 min and reached the viable epidermis where a small fraction was detected. Data collected for a longer time showed evidence of a progressive penetration of DMSO through the SC. DMSO could still be detected inside skin 72 h after application. Other conclusions about DMSO–lipids or DMSO–protein interactions could not be drawn during this study. However, in a study by Zhang et al. (2007b), reversible alteration of keratin secondary structure was shown using CRM when DMSO was applied in keratinocytes culture. They reported an appearance of β-sheet structures in the cellular keratin after treatment with DMSO; this change was reversible, and the original α-helix structure was recovered upon rehydration. This result was explained by strong complex formation between DMSO and water, which displaced the bound water that stabilizes the secondary structure of keratin.
Saar et al. (2010) used stimulated Raman scattering (SRS) microscopy for in vivo skin optical imaging in mice, first focusing on 3 vibration bands to image skin structure: lipids (CH2 stretching, 2845 cm−1), water (OH stretching, 3250 cm−1), and proteins (CH3 stretching, 2950 cm−1). This allowed imaging the water, lipid, and protein distribution of the SC and the viable epidermis (Fig 13.2a, b image of the protein distribution in the SC and viable epidermis). The corneocytes and the intercellular spaces clearly appeared, as well as the sebaceous glands in the epidermis, which appeared both in lipids and water images, that is, when the incident laser frequency was tuned to the lipids (CH2 stretching) or water (OH stretching) vibrations. The sebaceous gland appeared clear when the frequency was tuned to that of lipids vibration and dark when it was tuned to the water vibration. It was possible to image the ear of living mice by SRS frequency-tuned to the protein vibration (CH3 stretching) (Fig. 13.2c). SRS was also used by the authors to explore the skin penetration of drugs and excipients (Saar et al. 2010, 2011). They explored DMSO penetration on human skin by SRS imaging using a specific vibration of deuterated DMSO-d6 at 2120 cm−1 (2010). As shown in Fig. 13.2d, DMSO was found in the area surrounding the hair follicles, confirming the initial rapid penetration of DMSO into hair follicles. However, DMSO was not found to penetrate the hair itself.
Fig. 13.2
SRS skin imaging of the forearm of a volunteer; (a–c): the frequency was tuned to the CH3 stretching vibration of proteins at 2950 cm−1: (a): stratum corneum; (b) viable epidermis; (c) hair shaft; (d) SRS skin imaging after applying deuterated DMSO-d6 (the frequency was tuned to the specific vibration of DMSO-d6 2120 cm−1) in the same region as shown in (c)
13.3.3 Iminosulfuranes as Penetration Enhancers
A novel group of chemical penetration enhancers, iminosulfuranes, was studied by Song et al. (2005) on mouse and human skins. The objective was to design new penetration enhancers having high efficacy and less toxicity and irritation potency. The iminosulfurane enhancers were easily detected in the skin by their specific Raman peak at 670 cm−1; its intensity was normalized to that of the amide I vibration band (1743 cm−1). The results showed penetration of the enhancer into the SC to a depth of approximately 20 μm, the maximum content being found 5–10 μm below the skin surface. This new enhancer did not penetrate into the viable epidermis, which meant that it might bind to the protein and/or the lipids in the SC. Furthermore, its penetration enhancing activity was proved both for a lipophilic drug (hydrocortisone) and a hydrophilic one (caffeine). The penetration enhancement of caffeine was lower than that of hydrocortisone (Song et al. 2005).
13.4 Penetration Enhancement of Drugs Followed by Confocal Raman Microscopy
CRM was used in vivo and in vitro to investigate the penetration enhancement mechanism of several compounds. Both the skin penetration of the drug and the penetration enhancer has been measured, and the CRM spectra of the SC lipids were analyzed in order to get information about lipid ordering. The penetration of several drugs of various chemical structures and physicochemical properties was studied, as far as they possess a specific Raman signature allowing their identification in the skin. Examples of trans-retinol, metronidazole, ibuprofen, ketoprofen, and β-carotene are presented below.
Related posts:
 Retardation Strategies for Sunscreen Agents
 Human Native and Reconstructed Skin Preparations for In Vitro Penetration and Permeation Studies
 Stripping Procedures for Penetration Measurements of Topically Applied Substances
 Confocal Microscopy for Visualization of Skin Penetration
 Finite and Infinite Dosing
Stay updated, free articles. Join our Telegram channel

Full access? Get Clinical Tree


