(3.1)
where J is the flux of the permeant (mass per cm2), D is the diffusion coefficient and δc/δx is the concentration gradient. To determine how diffusion affects the permeant concentration with time, Fick’s second law of diffusion (Eq. 3.2), which is derived from Fick’s first law of diffusion and the differential mass balance, can be employed:

(3.2)
3.2.1 Permeation Kinetics
3.2.1.1 Infinite-Dose Permeation
A typical infinite dosing regimen will produce a permeation profile of cumulative amount permeated across a unit area of membrane versus time, as shown in Fig. 3.1. Initially, when a permeant is applied to the skin, molecules penetrate into and diffuse through the stratum corneum. Depending on the permeants’ physical and chemical properties (e.g. lipophilicity, hydrogen bond acceptor or donor potential), it may penetrate and diffuse rapidly or may bind to stratum corneum components. A lag phase is seen where the amount of permeant in the receptor compartment increases exponentially due to binding and the increasing concentration of permeant in the stratum corneum. After a sufficient time (again dependent on the nature of the permeant, typically shorter for lipophilic non-bound molecules, longer for hydrophilic molecules), binding sites become fully occupied (or at steady-state equilibrium), and a steady-state concentration gradient of the permeant develops across the membrane. Under these conditions, the flux profile becomes essentially constant, and the curve approaches a straight line. The linear portion of the graph represents the steady-state flux (J ss) and can be determined by simple linear regression of the linear portion of the graph (Crank 1975; Scheuplein and Blank 1971).
Fig. 3.1
Graph A (solid line) represents a typical permeation profile for an infinite dose regimen. The intercept on the horizontal axis, L, gives the lag time. The steady-state flux (J ss) is obtained from the gradient (dm/dt) of the linear portion of the graph, from t = t 1, where t 1 ≥ 2.7 L. Graph B shows an alternate situation where a plateau is reached following prolonged incubation, indicating deviation from infinite dose conditions, due possibly to donor depletion or non-sink conditions
Typically, the steady-state flux is assessed from an in vitro experiment under infinite dose conditions, with ‘perfect’ sink conditions where the receptor compartment is at zero concentration throughout. J ss can also be estimated by

where C 0 is the concentration in the outermost first layer of the skin and h is the membrane thickness. Practically, it is very difficult to measure C 0. However, the concentration of the permeant in the donor vehicle, C v, is easily obtainable or is usually known. Since C 0 and C v are related to the partition coefficient between donor and membrane (K m), where

then substitution of Eq. 3.4 into Eq. 3.3 gives Eq. 3.5, which is the most widely applied mathematical model in examining skin permeation data:

(3.3)
(3.4)
(3.5)
The lag time can be obtained by extrapolating the steady-state (linear) portion of the permeation graph to the intercept on the horizontal axis. Crank (1975) showed that the lag time, L, can be determined mathematically by

It has been estimated that the time required for most permeants to achieve steady-state flux is about 2.7 times the lag time (Barry 1983).
(3.6)
Permeant transport across the skin is sometimes described in terms of the permeability coefficient (K p), essentially a measure for the speed of transport across a membrane (often as cm/h):
Typically, the steady-state flux J ss and the permeability coefficient K p are obtained from an in vitro infinite dose experiment. As described above, J ss is obtained from the gradient of the linear portion of the permeation profile, and therefore, if the concentration of the permeant in the applied vehicle (C v) is known, then K p can be determined. K p is often used to characterise the skin permeation of permeants, as calculations for other parameters such as D and K m can be problematic as the membrane thickness (h), or the diffusional path length, is often unknown.
(3.7)
Estimates of steady-state flux and permeability coefficients should only be derived from data points beyond 2.7 times the lag time when (pseudo-) steady-state conditions are established (Kielhorn et al. 2006); using data before steady state is established leads to false estimates of permeability coefficients (Shah et al. 1994). It has been recommended that infinite dose permeation experiments should last for at least 24 h (OECD 2004a). However, an increase in exposure time may alter the integrity of the skin barrier (Kleszczyński and Fischer 2012). Typically, experiments are performed for 24–48 h (Boonen et al. 2012; Karadzovska et al. 2012; Fasano et al. 2012; Brain et al. 2005; Walters et al. 1997), although shorter durations have also been reported (Chen et al. 2011). It has been suggested that 72 h or even longer may be needed in some cases for an infinite dose to establish steady-state flux, especially for permanents that have very low fluxes or present difficulties for detection (Franz et al. 1993; Howes et al. 1996).
Although Eqs. 3.5, 3.6 and 3.7 are commonly used to evaluate infinite dose experiments, it is assumed that the skin membrane acts as a homogeneous membrane and that permeation through the stratum corneum is the rate-limiting factor for transdermal transport. This assumption is usually valid for most permeants, but for highly viscous vehicles, highly lipophilic or highly hydrophilic molecules, partitioning behaviour may become the limiting factor (Cross et al. 2001). Also, the equations assume perfect sink conditions throughout the experiment in order to ensure drug permeation is not affected by solubility in the receptor phase. For in vitro studies, flow-through diffusion cells maintain sink conditions by constant replenishment of the receptor fluid, but this may lead to dilution of the penetrant below the detection limit. For static diffusion cells, it is commonly regarded that sink conditions are maintained when the receptor fluid does not contain more than 10 % of the saturated concentration of the penetrant (Ng et al. 2010; Skelly et al. 1987). The most widely used receptor fluid is isotonic buffered saline, pH 7.4. However, for highly lipophilic compounds, the solubility in the receptor fluid may become the rate-determining step in skin absorption and may have a significant effect on the total flux measured. When solubility is a concern, the receptor phase can include lipophilic solvents which do not affect the skin barrier or a solubilising agent (e.g. 50 % ethanol, 6 % polyethylene glycol, 20 % oleyl ether or 5 % bovine serum albumin) (Skelly et al. 1987; OECD 2004a).
In reality, even under infinite dose conditions, depletion of the donor phase, non-sink receptor conditions and deterioration of the skin can occur with time. These factors may result in inaccuracies in steady-state flux and lag time estimations (Moody 2000). Therefore, particular caution has to be exercised in experiments where prolonged incubation times are necessary.
3.2.1.2 Finite-Dose Permeation
In vitro percutaneous absorption studies often utilise an infinite dose regimen to define a permeant’s properties, that is, steady-state flux, permeability coefficient and lag time. However, a major limitation of infinite dosing is its failure to mimic the application of topical drug formulations in common clinical situations, where a relatively small amount (i.e. a finite dose) of the formulation is used. Under these circumstances, steady-state permeation seldom occurs and, therefore, the permeability coefficient cannot be determined. Most in vivo experiments are based on finite dosing, although in some cases, infinite dose conditions may result when finite doses are applied repeatedly.
In contrast to the infinite-dose permeation profile, finite-dose application may result in a ‘pseudo steady-state’ condition, where the amount permeated may be transiently linear but then reaches a plateau, beyond which the amount permeated remains constant due to donor depletion (Fig. 3.2).
Fig. 3.2
A typical permeation profile for a finite-dose regimen. Depletion of the donor phase gives the characteristic plateau in region A. The maximum flux (J max) is obtained from the gradient (dm/dt) of the near-linear portion of the curve in region B. Given that steady-state flux may not be obtained before donor depletion becomes significant, the maximum flux may not represent steady-state flux
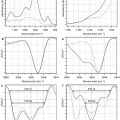
Alternatively, by plotting the amount penetrated between the time points (i.e. instantaneous flux) against time (Figs. 3.3 and 3.4), a peak is observed which corresponds to the maximum flux before appreciable donor depletion (Franz 1983; Kasting 2001). The maximum flux (J max) and the time to maximum flux (T max) are the most commonly reported parameters in finite dosing. These can be represented by (Scheuplein and Ross 1974; Crank 1975; Kasting 2001)
Here, D is the apparent diffusion coefficient, C 0 is the concentration of the permeant in the first layer of the stratum corneum, h is the thickness of the stratum corneum and δ is the thickness of the finite dose layer on the skin surface. For a finite dose, since δ is considerably smaller in comparison with h, δ can be neglected, leading to

Thus, it is possible to estimate the apparent diffusion coefficient (D), if the values of J max and T max are known. In addition to this mathematical model, J max and T max are sometimes obtained graphically from experimental data (Figs. 3.2 and 3.3) (van de Sandt et al. 2004; Wilkinson et al. 2006).
Fig. 3.3
Estimation of maximum flux (J max) from a graph of amount penetrated per unit time (assuming constant permeation area) versus time. In this case, the vertical axis represents instantaneous flux. The time taken to reach maximum flux is referred to as T max
Fig. 3.4
Exemplar data showing instantaneous flux of finite doses of loperamide and propylene glycol (PG) through human skin over time (Data are from Trottet et al. (2004). Figure copyright (2012) reprinted with permission from Elsevier)
(3.8)
(3.9)
(3.10)
Due to the nature of finite dosing, experimental problems can ensue, since applying a small finite dose formulation evenly across a membrane in vitro can be difficult. Since the bioavailability of drugs applied to the skin in finite doses depends on the amount of drug applied per unit area (Wester and Maibach 1976; Franz et al. 1993), a homogenous drug distribution over the whole donor area is needed to minimise variation within and between experiments.
Applying semisolid formulations homogenously poses more complications than liquid dosing. Semisolids are usually applied manually, using a mechanical device such as a glass rod (Hadgraft et al. 2003; Franz et al. 1993; Brain et al. 1995; Gupta et al. 1999) or spatula (Dreher et al. 2002; Trottet et al. 2004; Youenang Piemi et al. 1998) to help distribute the formulation evenly on the skin surface. In this case, it is important that the application device is also analysed in order to determine the actual dose applied to the skin. This is commonly done by extraction (Gupta et al. 1999) of the remaining drug from the application device, or by weight difference (Walters et al. 1997; Brain et al. 1995; Vallet et al. 2007). Sometimes, the permeant is dissolved in a volatile medium to allow easy application and homogenous distribution (Kasting and Miller 2006; Southwell and Barry 1984). The volatile solvent evaporates, leaving a thin film of the drug on the skin surface. However, the volatile solvent may extract some lipids from the stratum corneum, affecting the integrity of the skin membrane. Another method used for uniform dose distribution is by massaging the formulation onto the skin surface, but this mechanical stress may influence the absorption rate in some cases (Amidouche et al. 1994; Lademann et al. 2007, 2009). To date, a very limited number of publications have investigated drug formulation distribution over the incubation area (Lademann et al. 2008); homogenous distribution is generally assumed in many reports.
The degree of occlusion of diffusion cells during experiments can affect skin hydration and, consequently, drug permeation (Akhter and Barry 1985; Zhai and Maibach 2001; Sarpotdar and Zatz 1986). Some researchers recommend that the skin be exposed to ambient conditions to simulate the in-use conditions of topically applied formulations (Wilkinson and Williams 2002; Grégoire et al. 2009). However, evaporation of the vehicle and/or permeant can occur in non-occluded experiments which can impact significantly permeant absorption (Frasch et al. 2011). Moreover, the skin may become dry, and its barrier function can thus be affected (Selzer et al. 2013). Occlusion is also used during finite dosing to avoid drying of the skin surface due to application of small amounts of formulation, or to prevent evaporation, which could lead to a change in permeant concentration (van de Sandt et al. 2004; Koyama et al. 1994). However, care is required to avoid damage to skin integrity caused by excessive stratum corneum hydration (Zhai and Maibach 2002).
For finite dose studies, exposure times usually reflect ‘in-use’ scenarios to allow quantification of permeant absorption over a realistic period of time that relates to potential human exposure (OECD 2004a). Exposure times of up to 48 h are commonly used (Hadgraft et al. 2003; Gupta et al. 1999; Walters et al. 1998), but may be shorter to mimic exposure to rinse-off products (Brain et al. 1995, 2005; Okuda et al. 2011), or in studies on occupational exposure to hazardous materials (Howes et al. 1996; Moody et al. 2007). In such cases, data collection commonly continues for at least 24 h. On the other hand, if the drug formulation is for a once-a-week product, for example, the experiment design should mimic the application exposure period and thus should be performed over 7 days (Williams 2003).
Related posts:
 Retardation Strategies for Sunscreen Agents
 Confocal Raman Spectroscopy as a Tool to Investigate the Action of Penetration Enhancers Inside the Skin
 Human Native and Reconstructed Skin Preparations for In Vitro Penetration and Permeation Studies
 Confocal Microscopy for Visualization of Skin Penetration
Stay updated, free articles. Join our Telegram channel

Full access? Get Clinical Tree


