Fig. 7.1
(a) Gross appearance of newly formed adipose tissue 6 weeks after implantation of CGS incorporating ASCs impregnated with NSS. (b) 0.1 μg/cm2 of bFGF. (c) 1 μg/cm2 of bFGF. (d) 7 μg/cm2 of bFGF. (e) 14 μg/cm2 of bFGF
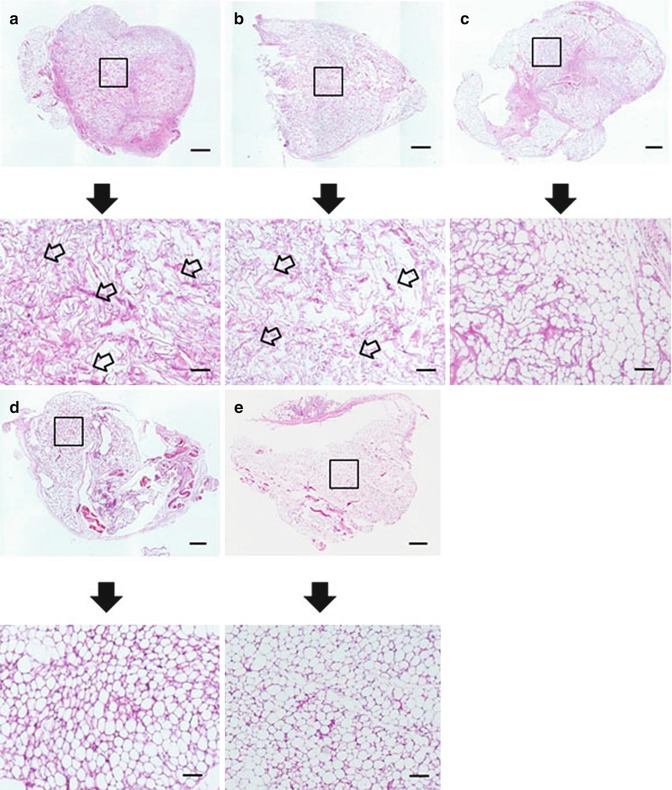
Fig. 7.2
Light microphotographs of histological sections of the implanted site six weeks after implantation of CGS incorporating ASCs impregnated with NSS (a), 0.1 μg/cm2 of bFGF (b), 1 μg/cm2 of bFGF (c), 7 μg/cm2 of bFGF (d), 14 μg/cm2 of bFGF (e). Scale bar: 1 mm. The area of the square is magnified below. The remained CGS impregnated with NSS and 0.1 μg/cm2 of bFGF was larger than in higher bFGF groups (the arrows). Scale bar: 200 μm
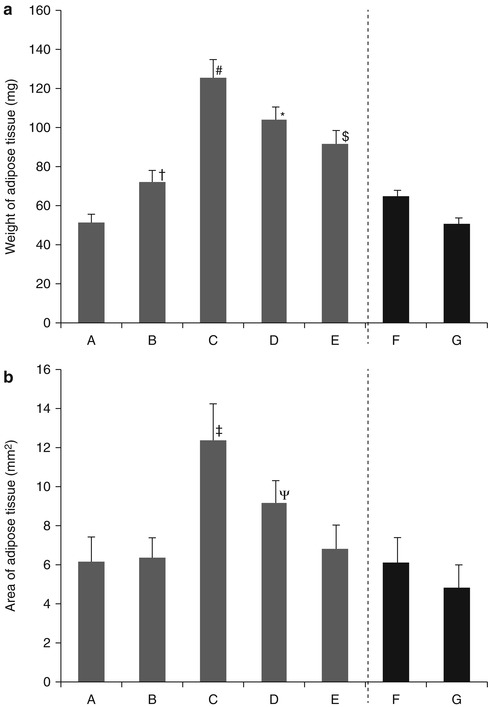
Fig. 7.3
(a) Effect of bFGF dosage on weight of adipose tissue newly formed six weeks after implantation of CGS incorporating ASCs impregnated with NSS (A), 0.1 μg/cm2 of bFGF (B), 1 μg/cm2 of bFGF (C), 7 μg/cm2 of bFGF (D), 14 μg/cm2 of bFGF (E), a collagen sponge incorporating ASCs and 1 μg/cm2 of free bFGF (F), a collagen sponge incorporating ASCs and NSS (G). # P < 0.05 vs. D, P < 0.01 vs. A, B, E, F, G. *P < 0.01 vs. A, B, F, G. $P < 0.05 vs. B, P < 0.01 vs. A, F, G. †P < 0.05 vs. A, G. (b) The area of adipose tissue newly formed six weeks after implantation of CGS incorporating ASCs impregnated with NSS (A), 0.1 μg/cm2 of bFGF (B), 1 μg/cm2 of bFGF (C), 7 μg/cm2 of bFGF (D), 14 μg/cm2 of bFGF (E), a collagen sponge incorporating ASCs and 1 μg/cm2 of free bFGF (F), a collagen sponge incorporating ASCs and NSS (G). ‡P < 0.05 vs. D, P < 0.01 vs. A, B, E, F, G. ΨP < 0.05 vs. F, P < 0.01 vs. G
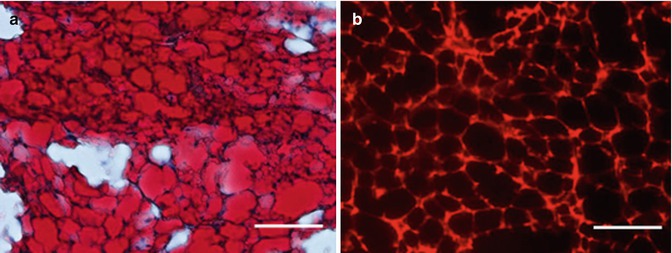
Fig. 7.4
(a) Oil Red O staining 6 weeks after implantation of CGS incorporating ASCs impregnated with 1 μg/cm2 of bFGF. (b) Under fluorescent microscopy, newly formed adipose tissue was PKH positive 6 weeks after implantation of CGS incorporating ASCs impregnated with 1 μg/cm2 of bFGF. In other groups, newly formed adipose tissue was also PKH positive. Scale bar: 100 μm
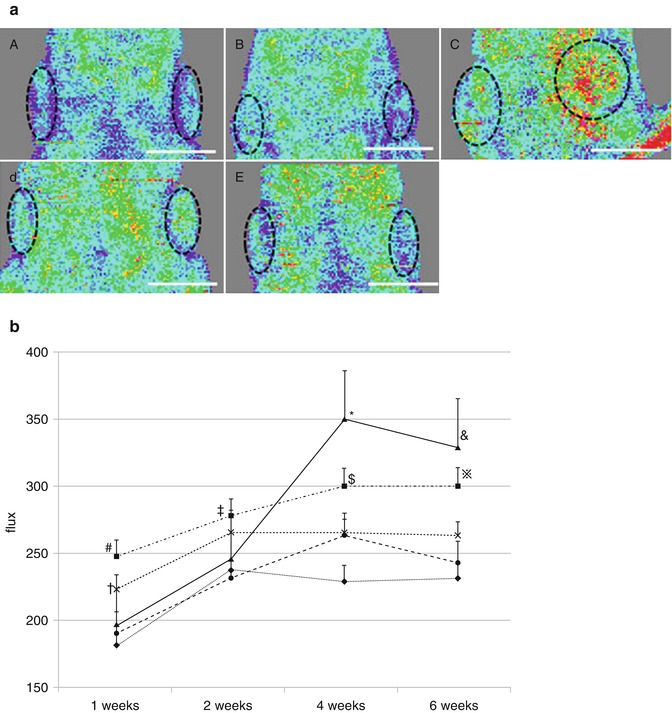
Fig. 7.5
(a) LDI six weeks after implantation of CGS incorporating ASCs impregnated with NSS (A), 0.1 μg/cm2 of bFGF (B), 1 μg/cm2 of bFGF (C), 7 μg/cm2 of bFGF (D), 14 μg/cm2 of bFGF (E). Scale bar: 1 cm. The dotted line shows implanted CGSs. (b) Time course of blood flow at the administered site. LDI treated with CGS impregnated with NSS (♦), 0.1 μg/cm2 of bFGF (•), 1 μg/cm2 of bFGF (▲), 7 μg/cm2 of bFGF (■), 14 μg/cm2 of bFGF (×). #P < 0.01 vs. NSS, 0.1 μg/cm2 of bFGF, 1 μg/cm2 of bFGF. †P < 0.05 vs. 0.1 μg/cm2 of bFGF, P < 0.01 vs. NSS. ‡P < 0.05 vs. NSS, 0.1 μg/cm2 of bFGF. *P < 0.01 vs. NSS, 0.1 μg/cm2 of bFGF, 14 μg/cm2 of bFGF. $P < 0.01 vs. NSS, 0.1 μg/cm2 of bFGF, 14 μg/cm2 of bFGF. &P < 0.01 vs. NSS, 0.1 μg/cm2 of bFGF, 14 μg/cm2 of bFGF. ※P < 0.01 vs. NSS, 0.1 μg/cm2 of bFGF
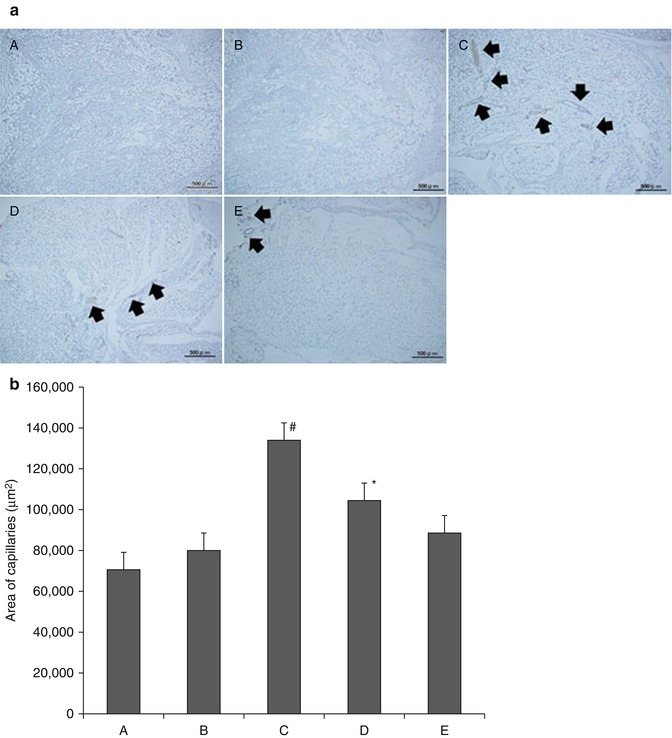
Fig. 7.6
(a) Neovascularization immunostained with von Willebrand factor in CGS (6 weeks after implantation). CGS treated with NSS (A), 0.1 μg/cm2 of bFGF (B), 1 μg/cm2 of bFGF (C), 7 μg/cm2 of bFGF (D), 14 μg/cm2 of bFGF (E). Black arrow indicates newly formed capillaries. (b) Neovascularization immunostained with von Willebrand factor in CGS (6 weeks after implantation). CGS treated with NSS (A), 0.1 μg/cm2 of bFGF (B), 1 μg/cm2 of bFGF (C), 7 μg/cm2 of bFGF (D), 14 μg/cm2 of bFGF (E). #P < 0.05 vs. D, P < 0.01 vs. A, B, E. *P < 0.05 vs. B, P < 0.01 vs. A
Surgical situations were considered where breast cancerous growths are resected along with surrounding tissues, resulting in an adipose tissue defect. Patients with axillary lymph node metastasis were not excluded, so it is possible that cancer cells might remain in breast or axillary adipose tissue. No cancer cells in ASCs in adipose tissue in vivo for 24 weeks after implantation were observed. There is a possible concern that the presence of an exogenous growth factor, such as bFGF, and ASCs could promote the growth of and metastasis of residual cancer cells in a breast cancer patient. In future patients, the procedure shall be performed in carefully selected patients to avoid the possibility of cancer cell dissemination and growth of residual cancer cells.
7.3 Conclusions
7.3.1 Clinical Applications for Adipose Tissue Engineering
At this time, clinical trials have been conducted for soft tissue cosmetic applications in which a cell-assisted lipotransfer (CAL) technique was developed for breast augmentation [79, 80]. Clinical results were generally satisfactory in terms of natural texture, softness, and contour resulting from soft tissue augmentation without foreign materials. At this time, human clinical studies utilizing 3D engineered adipose tissue constructs for soft tissue reconstruction have not been developed. However, as clinical interest in soft tissue replacement techniques increases, adipose tissue engineering will continue to improve. Clinical goals for adipose tissue engineering include regenerated tissue that both cosmetically and mechanically resembles that of original tissue, including mechanical integrity as well as sustainability and viability of the tissue over time. There are many and varied choices of biomaterials, cell sources, and growth factors. It is important to find the most suitable means for vascularizing 3D adipose tissue and dynamic pre-cultivation. Successful vascularization of 3D adipose tissue will allow for larger reconstructions thus enabling enhanced functional adipose tissue formation and maintenance. Future work is required to move closer to a clinically relevant engineered adipose tissue for soft tissue replacement therapy.
References
1.
2.
3.
4.
5.
6.
7.
8.
9.
10.
11.
12.
13.
14.
Flynn L, Woodhouse KA. Adipose tissue engineering with cells in engineered matrices. Organogenesis. 2008;4(4):228–35.PubMedCentralPubMedCrossRef
15.
Patrick CW, Uthamanthil R, Beahm E, Frye C. Animal models for adipose tissue engineering. Tissue Eng Part B Rev. 2008;14(2):167–78.PubMedCentralPubMedCrossRef


