Requirements
Environmental
Usability in IT-environment
0
0
100
25
100
Equipment needed
50
100
50
0
50
Usability in clinical settings
0
0
100
25
100
Usability in preclinical settings
0
0
100
25
100
Ease of use
100
75
75
0
50
Quality
Exactness
25
50
75
0
50
Low inter-rater variability
0
50
75
100
100
Medical documentation
Enable timeline
0
0
75
100
100
Enable automatic encoding
0
0
0
100
100
Enable documentation of lateral
0
25
25
100
100
Physiology
Body shape
0
0
0
100
75
Aging (of a surface point)
0
0
0
50
100
Extreme body deformations
0
0
0
75
25
Changing proportions
0
50
50
100
75
Size
0
50
50
100
100
Sex, age
0
0
0
100
100
Planimetric
Lund Browder (adapted planimetric) manually
Lund Browder (adapted planimetric) electronically
3D scan
Adapted 3D model
175
400
775
1100
1350
14.4 Challenges in TBSA Evaluation
14.4.1 Types of Errors in TBSA Calculations
14.4.1.1 Painting Error
Painting error is the error which occurs when a burn wound is transferred to a model. This means that more investigators see the same burn and paint it differently. This error can be determined by seeing a burn and drawing it on an evaluation sheet. The difference in extent and localization shows the transfer error.
14.4.1.2 Estimation Error
Estimation error is the error happening when the percentage of the area of the body burned already painted on the model is estimated by the investigator and declared as a certain percentage of the area. Estimation errors can be combined with transfer errors. The estimation error was investigated by Miller [21] who sent charts of hypothetical patients to burn units and found out that there were significant differences in the calculated burn size both by doctors and by nurses. This phenomenon was described by Berry as well [22], not using charts, but the calculations of TBSA.
He compared estimates of transferring facilities to the estimations of the centers to which patients were transferred. Out of 333 patients transferred, 105 documentation of an exact TBSA were found and could be used for this study. Only 12 patients showed the same estimations, 65 patients were rated higher by the transferring units, and 28 proved to be underestimated. The mean TBSA was 22,5%, so there were many burns not being extensive. The question remains whether the kind of error was simply misestimation or whether there was a specific intention to overestimation to find a good reason for the transfer. In average, the transferring hospitals estimated the TBSA 5% higher than the burn centers.
The error could even be bigger due to the general overestimation done by Lund Browder charts. This error has been described and investigated together with transfer error by Wachtel [23] although he used planimetry as “golden standard.” The Lund Browder based charts showed a significant difference to the Rule of 9.
14.4.1.3 Inter-rater Error
The sum of the above-described errors is the inter-rater error caused by different estimates of one burned area by different estimators.
14.4.1.4 Calculation Error
Calculation error is the possible error, when calculations are done when summing up the total percentage of TBSA affected (miscalculations in additions, multiplications, percentage calculation) Usually this kind of error can be reduced when summing up the areas affected by the burn and do the control with the area not affected what should sum up to 100%.
14.4.1.5 Methodical Error
Methodical error is happening when a three-dimensional surface is transferred to the two-dimensional model, e.g., of Lund Browder or when a method attributes the wrong percentage to a certain area.
As an example: Lund Browder Error:
The chart is showing different percentages of the body surface, compared to objective methods like 3D body scan or measurement of real surfaces by spherical planimetry.
14.4.1.6 Model Error
Model error happens, when the model does not reflect the body shape of the patient. This error happens when obese patients or patients with an unusual body shape are reduced to average models which are not adapted.
14.4.2 BIAS Caused by Secondary Motivation
All methods are open for motivational error. In any system, you can draw bigger burns than they are. Photo comparison and overlay is a method to reduce this influence and make the evaluation more objective. Intended overestimation in 3D systems is more obvious than in 2D systems.
14.4.2.1 Motivation
An example of how to improve motivation was our investigation about burn size estimation by participants of international burn meetings. By the chance of winning a price (iPad), the standard deviation of estimates was reduced in comparison to other studies.
14.4.2.2 Funding
Another reason could be a reimbursement strategy of burns treatment. An example of this is a DRG Group dependent from TBSA.
14.4.2.3 Psychology and Vanity
A psychological aspect should not be missed: When a patient is successfully treated, it feels better to “diagnose” a big burn as this gives better self-esteem than the survival of a patient with a small burn and when a patient died despite our treatment it must have been a big burn as he would have survived otherwise. This happens, e.g., when benchmarking processes are done between centers.
14.5 Technical Aspects of TBSA Calculation Methods
14.5.1 Paperless and IT Less Documentation
14.5.1.1 A Simple Estimate by the First Guess
A simple estimate by the first guess is a time-saving method. Just by looking at a patient, TBSA is estimated. The method seems to be inexact, but Hintermüller could demonstrate that the results were nearly comparable to the “rule of palms” [24]. Both methods resulted in an overestimation of TBSA; the simple estimate was the most inexact method. This method often is hidden under the term “clinical assessment.”
14.5.2 Paper-Based Charts
14.5.2.1 Simple Drawing
Long before the time when charts with relations existed , simple drawing in paper was done [2]. By mental arithmetic, the system is open to nearly all kinds of error combined with low inter-rater reliability.
14.5.2.2 Drawing on a Model on Paper
Example of this is the Lund Browder Chart. The burn extent and quality is drawn on a model on a piece of paper. Evaluation of the percentage of the areas affected and calculations must be done by estimate.
14.6 IT-Supported Drawings and Calculations
IT-based systems may still have a methodological error, but inter-rater reliability is much better than the hand and brain work, no matter whether they are two- or three-dimensional [24–27].
14.6.1 Two-Dimensional IT Systems
2D models are based on simple drawings of the human body on a plane screen of a computer. These models do not consider three dimensionalities of the human body, and in many applications, there is no space to register the lateral and other parts of the body.
Many 2D models do not reflect the difference in sex, body shape, size, and weight of the patients. On the other hand, they are easy to be handled but can only give a very crude overview about the type of burns and areas affected especially on the lateral body parts and miss the true extent of areas. Different types can be described:
14.6.1.1 Simple Planimetry
This refers to a simple pixel count in a two-dimensional picture. Some electronic devices use this approach.
14.6.1.2 Corrected Planimetry
Corrected planimetry is a pixel count in a two-dimensional picture corrected by a certain body percentage advised to a certain body area.
14.6.2 Examples for Corrected Planimetry Are
14.6.3 Three-Dimensional Systems
3D models can be adapted to the individual properties of the patients.
14.6.4 3D Models Can Be Better Adapted to the Reality
Three-dimensional systems avoid the methodological error of reduction to a 2D drawing. They can be adapted to body size, weight, sex, and body shape.
Existing methods show a high validity in grown-ups with BMI < 30 [27]. Limitations are in severe obesity or unusual body proportions. The accuracy of the model is dependent on the adaptation to the model to the individual patient’s body shape and properties.
14.6.4.1 Individual Measurement Based Systems
Individual measurement based systems should show an accurate picture of the body of the patient to be evaluated such considering gender, height, weight, age, and body shape.
An exact 3D scan seems to be a total individual and exact 3D model. They have been mainly used in studies till now, having shortcomings themselves but also showing the weakness of other methods [30]. A complete 3D body scan consists of a series of sub-scans which must be adapted to one.
14.6.4.2 Model-Based Systems
Models are used and adapted to gender, height, weight, age, and body shape. A choice of a model out of a library is done by the system or the user. It is then adapted to the different qualities as far as the IT system provides. Adaptation can be based on measurements. The choice of a model out of a library can be partially or total IT supported based on these. Another way is just hoping that the model fits best to reality out of the offered choice by visual compliance.
Lund Browder offers one model with one standard type of body shape. The proportions of certain body parts can be adapted to different ages. Just one model to draw on it represents three different models, and by this, it is a library based system.
14.6.4.3 Examples for 3D Methods
14.7 Error Types Dependent on Methods (Table 14.2)
14.7.1 Methodological Error
14.7.1.1 The Methodological Errors of Two-Dimensional Charts
The Projection Error
Susceptibility to error types of different methods
Painting error | Estimation error | Calculation error | Methodological error | Open for motivational error | |
|---|---|---|---|---|---|
Paper based | ∗∗∗∗∗ | ∗∗∗∗∗ | ∗∗∗∗∗ | ∗∗∗∗∗ | ∗∗∗ |
IT-based 2D | ∗∗∗ | ∗∗∗∗ | – | ∗∗∗ | ∗∗∗ |
IT-based 3D | ∗ | – | – | ∗(dep. on body shape) | ∗∗∗ |
Calculation of Projection Error
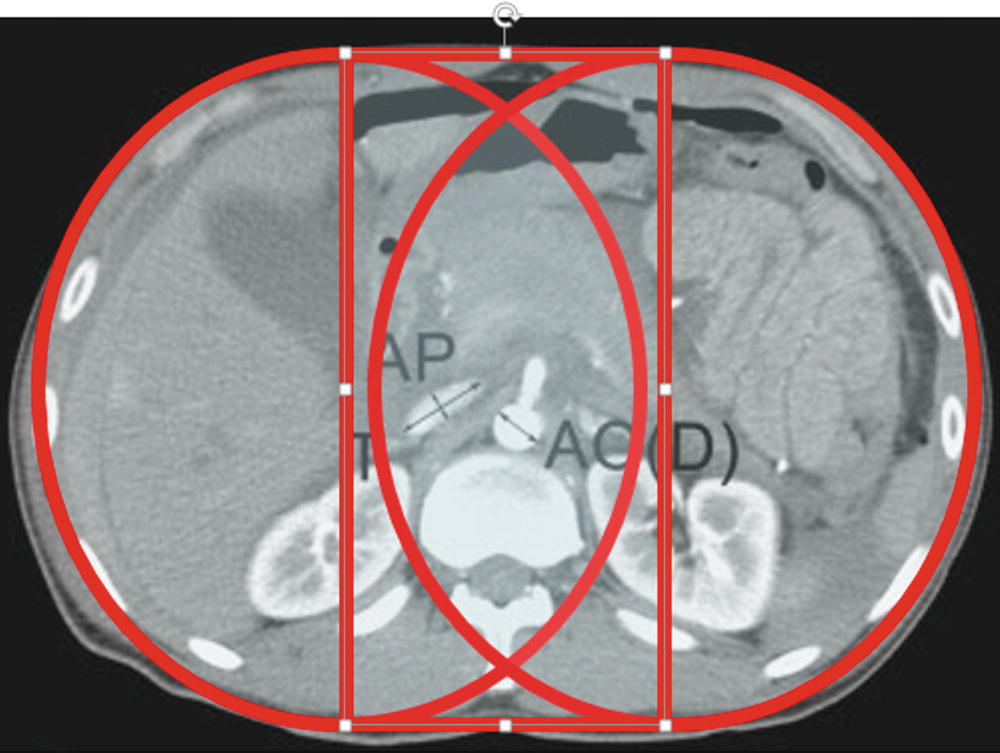
Shows how a body can be abstracted to circles and rectangles
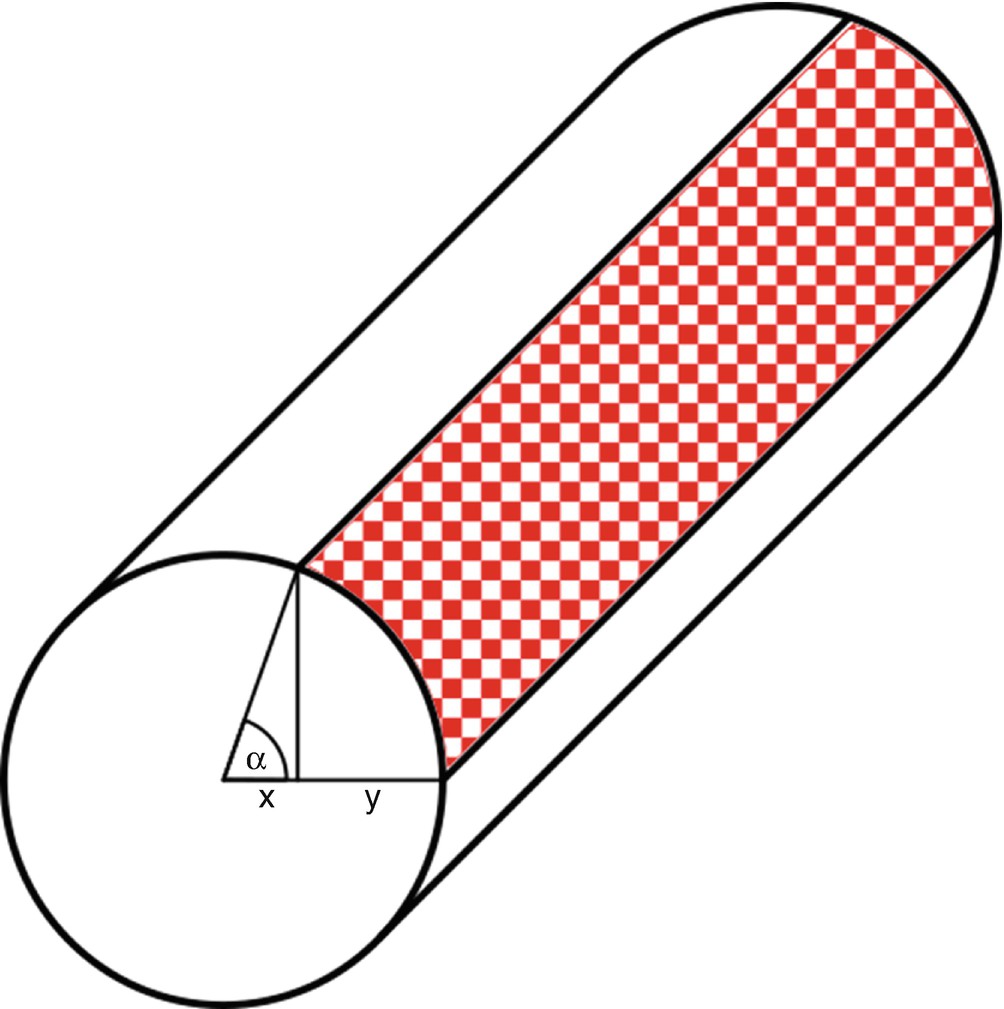
Projection of a burnt area on a plane 2D system compared to 3D beginning from 0° to alpha: y is the projection of the circle segment to the plane
Presumed: radius = 1, height = 1, the area of the plane projection can be calculated by the formula (1 − x) ∗1 where x = cos (alpha).
Y = 1 − cos(alpha); Projected area = (1 − cos(alpha) × 1). In a three-dimensional measurement, the red area can be calculated as follows: (2rπ × α) ∗h/360 = 2pi × alpha)/360
Cumulated difference in true 3D areas to projected 2D areas from
α | Area 2D | Area 3D | Percentage 2D area of 3D area | Percentage 3D area of 2D area | Difference 3D-2D |
|---|---|---|---|---|---|
0–10 | 0.01519225 | 0.17453278 | 0.08704524 | 11.4882794 | 0.15934053 |
0–20 | 0.06030738 | 0.34906556 | 0.17276806 | 5.78810686 | 0.28875818 |
0–30 | 0.1339746 | 0.52359833 | 0.25587285 | 3.90819117 | 0.38962374 |
0–40 | 0.23395556 | 0.69813111 | 0.33511693 | 2.98403304 | 0.46417555 |
0–50 | 0.35721239 | 0.87266389 | 0.40933559 | 2.44298326 | 0.5154515 |
0–60 | 0.5 | 1.04719667 | 0.47746523 | 2.09439333 | 0.54719667 |
0–70 | 0.65797986 | 1.22172944 | 0.53856429 | 1.85678852 | 0.56374959 |
0–80 | 0.82635182 | 1.39626222 | 0.5918314 | 1.68967041 | 0.5699104 |
0–90 | 1 | 1.570795 | 0.63662031 | 1.570795 | 0.570795 |
The numbers in the table above are only calculated for one-quarter of the body and as total angles.
Result: In a lateral wound between 0° and 10° it can be demonstrated that the 3D registration calculates 11 times the area which is calculated by the 2D registration and 1.5 times for the whole area of a quarter of the body cylinder and the double amount when the anterior and the posterior quarters are affected.
Calculation of Projection of Segments of 10° Each (Fig. 14.3)
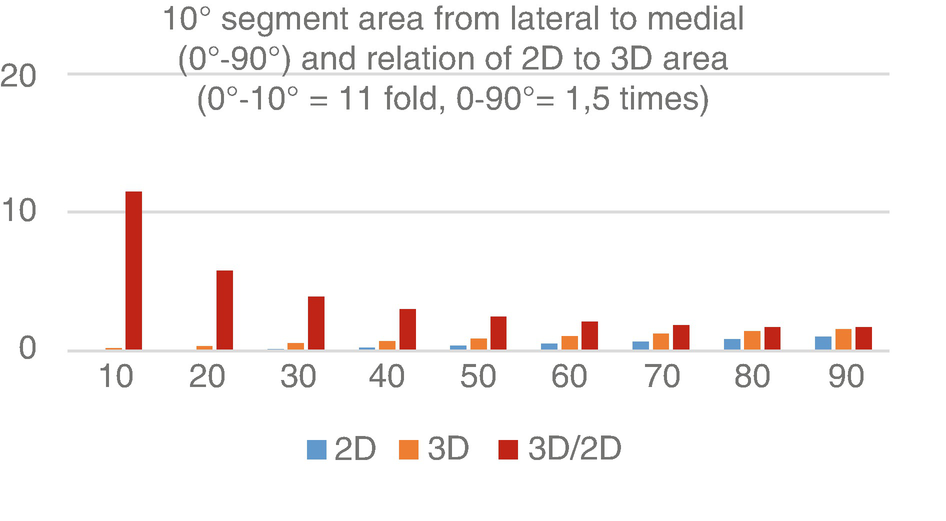
How much of a 3D area (10° segment) do you really see in 2D projection?
The calculation for the plane 2D area is
Presumed r = 1, h = 1; Area 1 = r (cos (β) − cos (α)) ∗h where r and h are eliminated as 1
And for the 3D documentation: 2rπ∗(α − β) × h where r and h are eliminated as 1
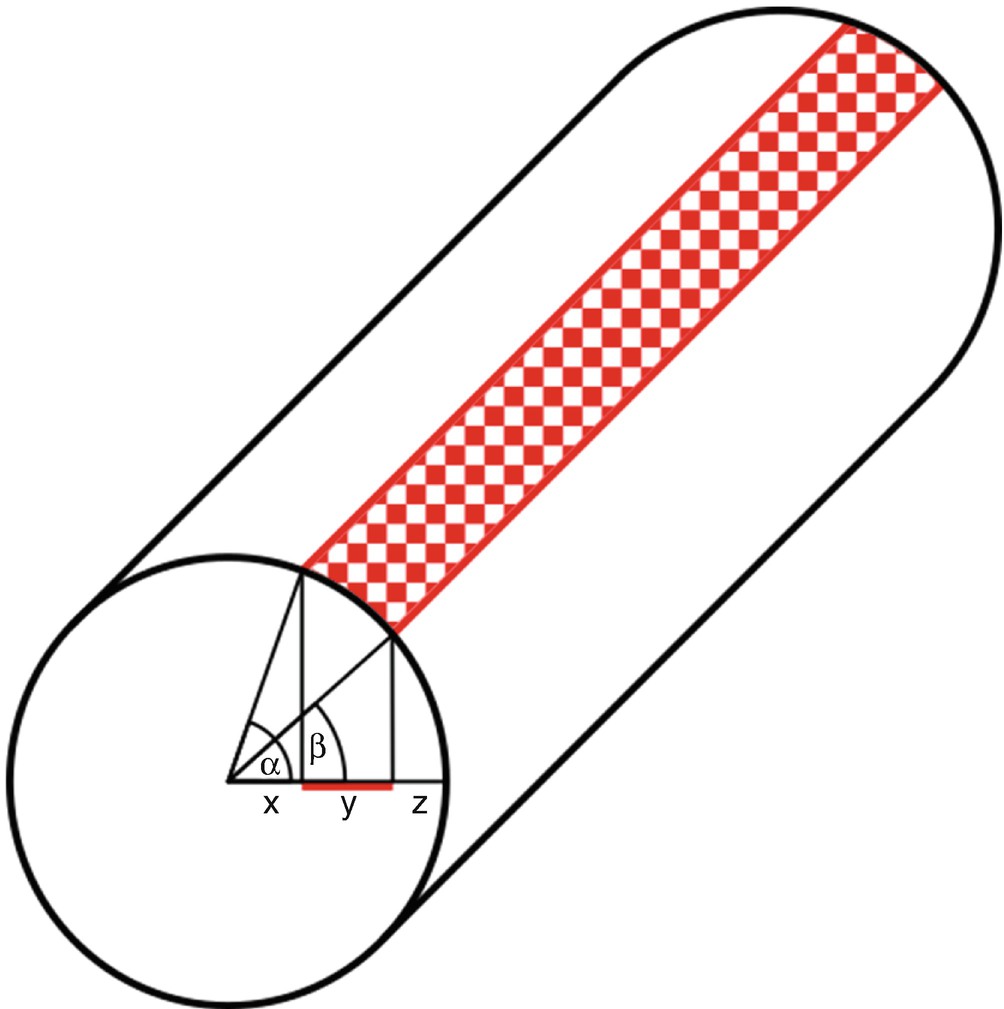
Shows how a 10° cylinder segment is projected to a 2D plane
Shows the numeric differences between a 3D cylinder segment and its projection to a single plane
Angle | cos | cos > – Cos < | Segment 3D | 2D/3D∗100 percentage projected on 2D | 3D/2D |
|---|---|---|---|---|---|
0–10 | 1 | 0.01519225 | 0.17453278 | 8.7045236 | 11.4882794 |
10–20 | 0.98480775 | 0.04511513 | 0.17453278 | 25.8490885 | 3.86860836 |
20–30 | 0.93969262 | 0.07366722 | 0.17453278 | 42.2082419 | 2.36920553 |
30–40 | 0.8660254 | 0.09998096 | 0.17453278 | 57.2849192 | 1.74566014 |
40–50 | 0.76604444 | 0.12325683 | 0.17453278 | 70.6210232 | 1.41600894 |
50–60 | 0.64278761 | 0.14278761 | 0.17453278 | 81.8113431 | 1.22232439 |
60–70 | 0.5 | 0.15797986 | 0.17453278 | 90.5158668 | 1.10477868 |
70–80 | 0.34202014 | 0.16837197 | 0.17453278 | 96.4701117 | 1.03659049 |
80–90 | 0.17364818 | 0.17364818 | 0.17453278 | 99.493161 | 1.00509421 |
Result: It can be shown that the projection of wounds lateral from 60° only shows between 90 and 8% of the true area. This effect is doubled when the anterior and the posterior quarters are affected!
14.7.1.2 The Standardization Error
The standardization error is the error happening when the measurement has an immanent system error due to the type of standardization of the measurement. This can be demonstrated by showing the different results of different methods of measurement.
This can be demonstrated by computer simulation:
Lund Browder chart was compared to the male and female 3D model (BurnCase 3D) and male and female scan models and to Make Human Taiwanese models based on the measurements of Yu. Typical areas of the body were selected, and the total percentage of body surface area as indicated by the different systems were compared.
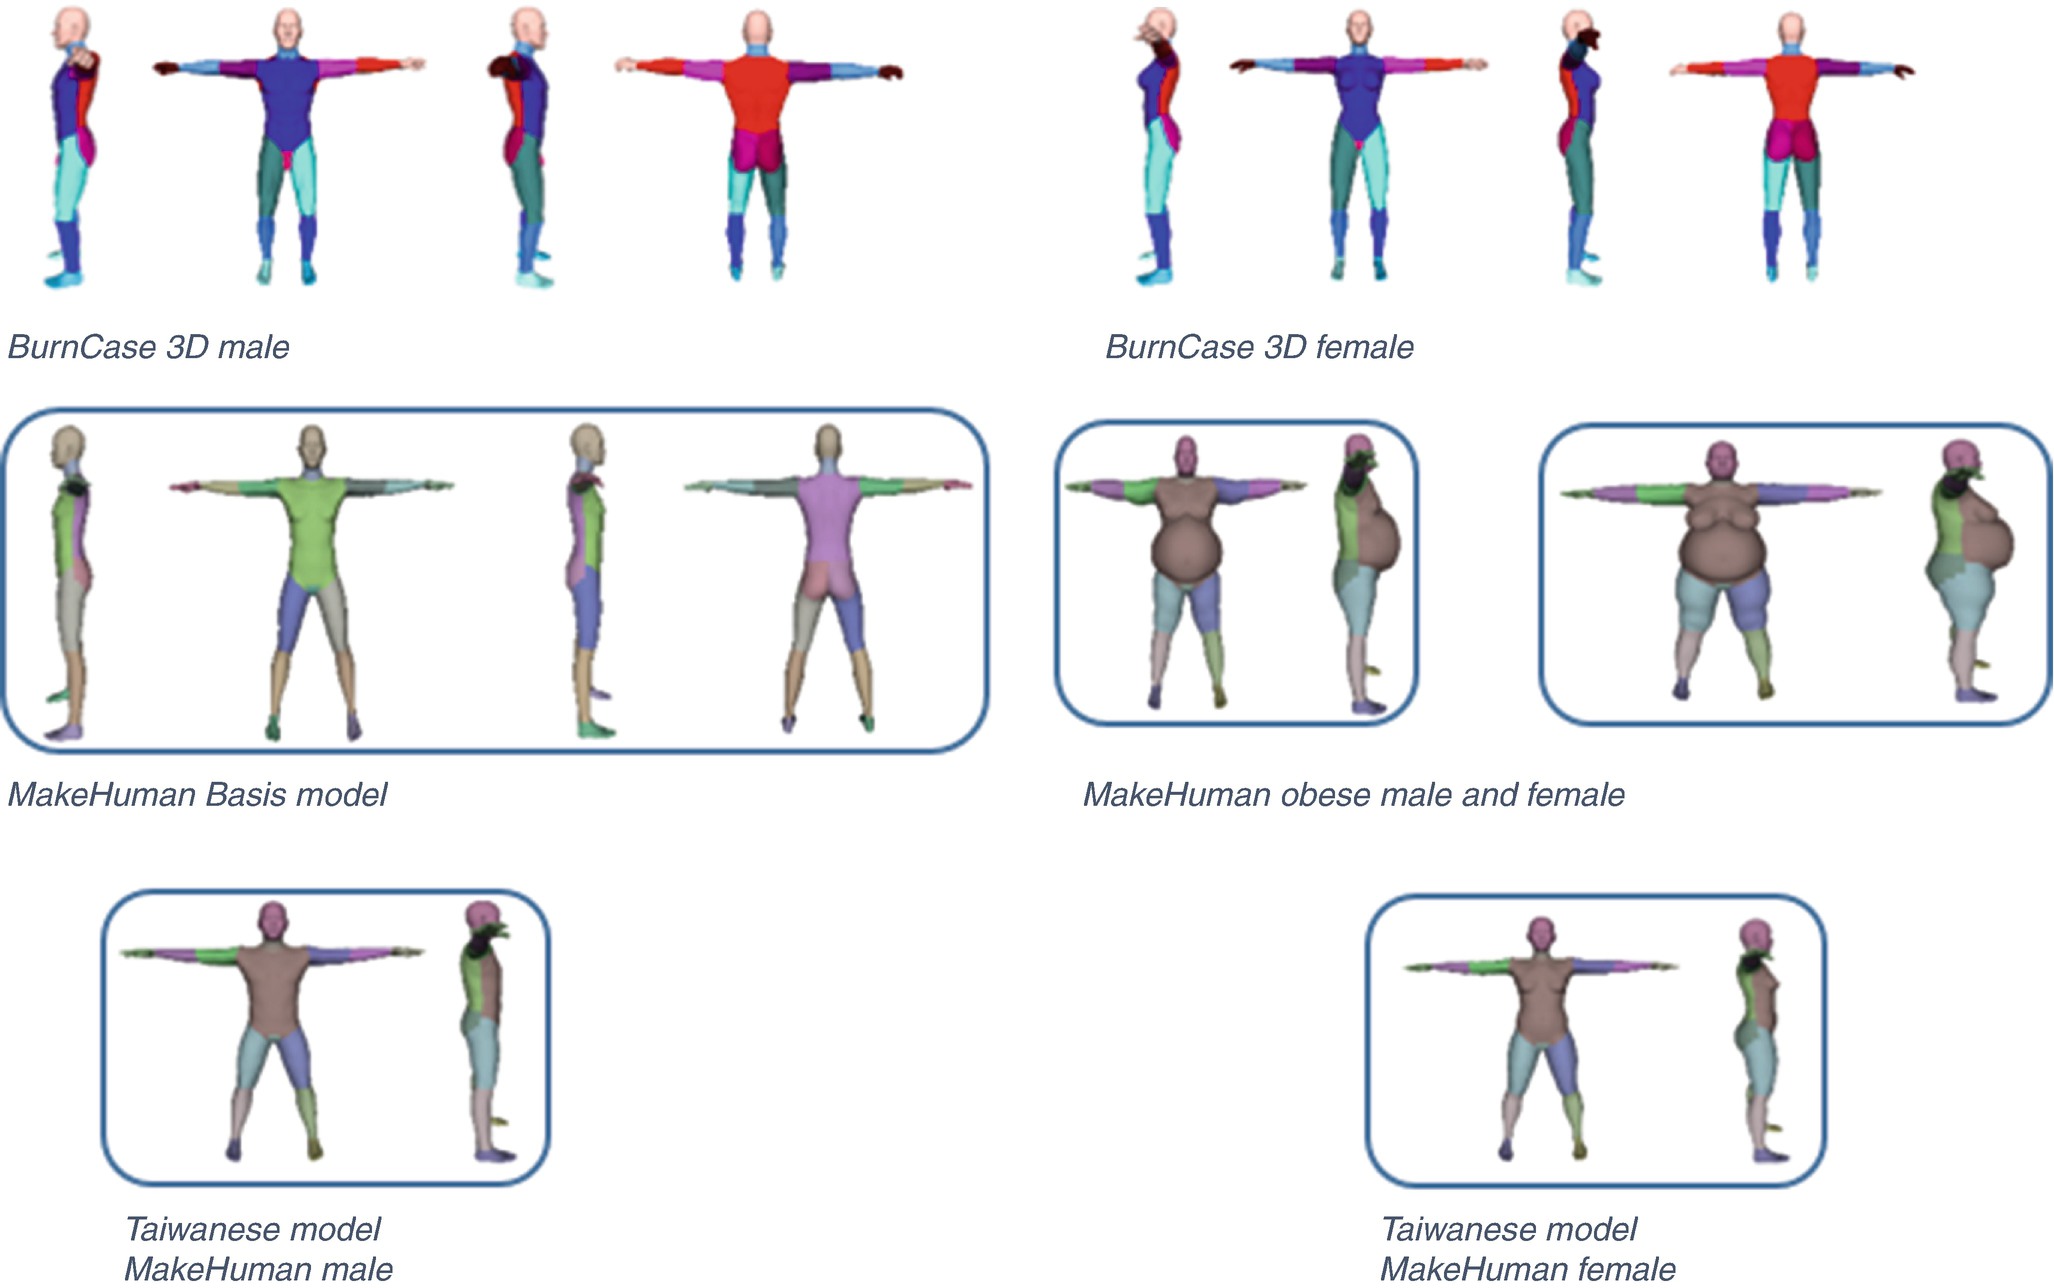
Shows the different models tested for comparison
Results of comparison of body areas in different models
Method | Lund Browder | BurnCase 3D | Yu et al. | Make Human obese | Make Human model adapted to average of Taiwanese Body Bank | |||
|---|---|---|---|---|---|---|---|---|
Male | Female | Male | Female | Male | Female | |||
Region | % BSA | % BSA | % BSA | % BSA | % BSA | % BSA | % BSA | % BSA |
Head | 7 | 6.71 | 7.36 | 7.43 | 5.76 | 6.09 | 8.26 | 8.06 |
Neck | 2 | 1.39 | 1.38 | 2.67 | 1.05 | 0.98 | 1.5 | 1.09 |
Anterior trunk | 13 | 13.32 | 12.9 | 14.94 | 20.6 | 20.56 | 13.68 | 15.46 |
Posterior trunk | 13 | 9.78 | 8.27 | 10.97 | 11.76 | 10.38 | 10.7 | 9.88 |
Right buttock | 2.5 | 3.01 | 3.38 | 2.55 | 2.87 | 3.34 | 2.32 | 3.06 |
Left buttock | 2.5 | 3 | 3.21 | 2.55 | 2.88 | 3.37 | 2.33 | 3.1 |
Genitals | 1 | 1.17 | 0.26 | 0 | 0.44 | 0.5 | 0.41 | 0.5 |
Right upper arm | 4 | 4.39 | 4.88 | 4.11 | 4.31 | 4.07 | 4.42 | 4.02 |
Left upper arm | 4 | 4.36 | 4.82 | 4.11 | 4.41 | 4.16 | 4.51 | 4.13 |
Right lower arm | 3 | 3.64 | 3.24 | 2.99 | 3.15 | 2.89 | 2.93 | 2.65 |
Left lower arm | 3 | 3.63 | 3.21 | 2.99 | 3.15 | 2.88 | 2.93 | 2.65 |
Right hand | 2.5 | 2.2 | 2.08 | 2.32 | 2.02 | 1.7 | 2.5 | 1.98 |
Left hand | 2.5 | 2.2 | 2.07 | 2.32 | 2.02 | 1.7 | 2.5 | 1.98 |
Right thigh | 9.5 | 11.25 | 12.24 | 9.93 | 9.03 | 10.25 | 10.38 | 11.14 |
Left thigh | 9.5 | 11.07 | 12.11 | 9.93 | 8.94 | 10.1 | 10.29 | 11.01 |
Right shank | 7 | 5.97 | 6.2 | 6.83 | 6.34 | 6.2 | 6.98 | 6.62 |
Left shank | 7 | 6.14 | 6.14 | 6.83 | 6.34 | 6.2 | 6.98 | 6.62 |
Right foot | 3.5 | 3.4 | 3.13 | 3.28 | 2.47 | 2.31 | 3.19 | 3.03 |
Left foot | 3.5 | 3.39 | 3.13 | 3.28 | 2.47 | 2.31 | 3.19 | 3.03 |
Related posts:
 of Burn Patients to the Burn Center Including Burn Wound Evaluation
 Care of the Burned Patient
 Management of Facial Burns, Acute Versus Long-Term, Surgical Versus Non-surgical Face Transplant
 Management of Burn Patients and Fluid Resuscitation
 Improvement in Burn Care
 Reconstruction: The Role of Integra in the Dorsum Hand and Wrist Reconstruction
Stay updated, free articles. Join our Telegram channel

Full access? Get Clinical Tree


