12 Patient-centered health communication
Synopsis


Healthcare decisions
Yet how are these decisions made in practice? Do physicians and patients generally share the decision-making process? Patient-centeredness is one of the six dimensions identified by the Institute of Medicine for improving quality of care1,2 and an integral part of the “Triple-Aim:” improving the care experience, improving the health of populations, and reducing costs.1 However, patient involvement is not always observed in practice. In many types of medical treatment decisions, physician preference determines the choice.3,4 For example, if surgeons are experienced in or prefer a particular technique, this knowledge will influence their conversations with patients about available reconstruction options. Providers may not be aware of this bias, or may not be cognizant of the fact that patients have different values regarding the potential benefits and harms of treatment. Consider two women with stage I breast cancer who have been informed that chemotherapy will reduce their chance of recurrence by 1–2%. These women may feel differently about whether that risk reduction is worth exposure to the potential harms of chemotherapy. To some women, that 1–2% risk reduction will sound very large, while to others, it will feel small and worth foregoing additional treatment.
Unwarranted variation in medical practice
These physician preferences may be observable by examining practice patterns across geographic regions. Dr Jack Wennberg developed a methodology (see the Dartmouth Atlas Project at: www.dartmouthatlas.org) enabling the comparison of procedure rates and the identification of regional variation across hospital systems and localities. This methodology segments the United States into 3436 Hospital Service Areas (HSAs) representing local healthcare markets. These HSAs are then aggregated to 306 Hospital Referral Regions (HRRs), each of which is a market for tertiary care. All HRRs contain at least one city where both cardiovascular and neurosurgery are performed (for additional information about these regions, see http://www.dartmouthatlas.org/data/region/).
Dr Wennberg’s research determined that dramatic geographic variation exists across these regions of the United States in terms of the number of hospital and doctor visits, surgical procedures, and other treatments. Some of this variation is unexplained, in that it persists even after adjusting for factors such as case mix and physician payment systems. This variation instead may reflect the general consensus of the local medical community.3,5,6 Rates of surgical procedures alone show up to 10-fold differences in procedure rates.7 This variation in surgical procedures has been termed a “surgical signature”.8,9 When this unexplained variation is due to factors other than patient preference, one can argue that it represents unwarranted variation.
Categories of variation and preference-sensitive decisions
Dr Wennberg characterized this unwarranted variation into three types: the underuse of effective care, the overuse of supply-sensitive care, and the misuse of preference-sensitive care.4 Effective care is defined as those interventions where evidence would routinely support their use; underuse of this type of care often is a patient safety issue. For example, the use of a beta-blocker in a patient with a myocardial event is considered standard of care. Underuse would occur if a beta-blocker is indicated but not prescribed for one of these patients.
Supply-sensitive care refers to care driven by an oversupply of resources such as specialists or hospital beds, and these excess resources result in an overuse of services. An example is the management of chronic illness. Variation exists because medical evidence is lacking to determine the appropriate use of resources, such as number of return visits or whether patients should be hospitalized or referred to specialists. Excess capacity will be filled in these situations. Finally, preference-sensitive care involves situations where treatment choices include multiple options with trade-offs between risks and benefits. Under these conditions, the choice of treatment should belong to the patient4 or the patient may receive treatment they neither need nor want. For example, a Canadian study of patients with hip and knee arthritis showed that only 8–15% of patients eligible for arthroplasty definitely wanted to undergo the procedure.10 As such, unwarranted variation in preference-sensitive care is considered a “misuse” of medical resources.
Variation in surgical decisions
Many surgical decisions fall into the category of preference-sensitive care. The amount of variation in these procedures can be more clearly illustrated with Medicare data collected in the Dartmouth Atlas Project. Figure 12.1 displays what are called “turnip plots.” These plots show rates of surgical procedures for hip fracture, knee replacement, hip replacement, and back surgery relative to the US average for Part A Medicare enrollees in 2007. Each dot on the plot represents one of the 306 HRRs. The scale on the y-axis ranges from 0.1 to 10.0. A dot at 3.0 would be an HRR that has three times the rate of surgeries as the US average; a dot at 1.0 would represent an HRR equal to the US average; and a dot at 0.5 would correspond to an HRR with a rate that is 50% lower than the national average. Variation increases as the plots become taller and narrower.
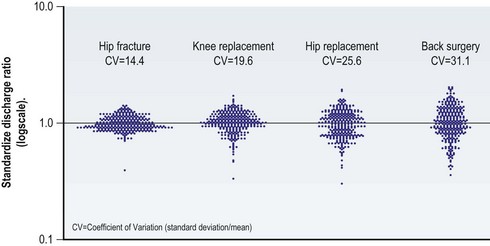
The turnip plot for hip fractures shows the least variation in procedure rates across the United States. The HRRs are tightly clustered together, with a coefficient of variation equal to 14.4. The coefficient of variation is the standard deviation (SD) divided by the mean, and commonly is used to represent the amount of variation within a particular measure or variable.11 In comparison with hip fracture, the coefficients of variation for knee replacement, hip replacement, and back surgery are 19.6, 25.6, and 31.1, respectively. Variation is lowest for hip fracture because surgical management of hip fracture is an accepted standard of care (or effective care). With effective care, preferences of the surgeon and the patient are closely matched. In contrast, surgical necessity for procedures like knee replacement, hip replacement, and back surgery is less well defined. This variability is reflected in the procedure rates.8
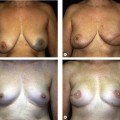
Plastic surgery is no exception. Postmastectomy reconstruction rates vary both across countries and within the United States.12,13 In an analysis of 81 479 cancers, Polednak observed rates varying from 3.3% in Hawaii to 16% in Atlanta, even after adjusting for factors such as stage at diagnosis.12
These differences may be driven by regional opinion about whether or when these procedures are indicated. Or they may result from provider experience, preference, or personal opinion about which techniques provide the best outcome. Misinformation or lack of knowledge on the part of the referring provider also may cause variation in postmastectomy reconstruction rates.14 Note, however, that all of these reasons revolve around the provider, not the patient. If reconstruction decisions were made based on patient-centric factors (all options made available to patients, and all risks and benefits clearly defined), we would expect to observe similar rates of each procedure across regions given a fixed patient profile.
One area of debate regarding physician and patient preference involves whether women with early stage breast cancer should be treated with breast conservation or mastectomy. Some authors believe high rates of mastectomy suggest that women are unaware that breast conservation is an option. Others believe that patient preference is being trumped by physician preference or by nonclinical factors such as the availability of radiation therapy required for breast conserving surgery.15,16 High rates of breast conservation have been suggested as a quality measure. However, Collins et al.17 showed that approximately 35% of well-informed women choose mastectomy, even when breast conservation surgery was an option. Therefore, high rates of breast conservation may not reflect patient preference. No-one can really say which rate is right. However, in situations where practice patterns differ and the choice will not affect survival, we should ask whether the patient was adequately and appropriately involved in the decision-making process.
What about evidence?
Another reason for variation in preference-sensitive care is that even when there is a single best option, doctors may not be aware of it. There is a nearly endless array of medical evidence accumulating, and everyone in every specialty is challenged to keep up. In 1991, the Pew Health Commission estimated that if a conscientious health professional were to read two articles every day, in 1 year, he or she would be over 800 years behind in the literature.18
Worse than not knowing, clinicians may have strong evidence to dictate practice and be well aware of that evidence – yet still fail to act on it. The Rand Corporation conducted a study revealing that only 45% of adults presenting with an acute myocardial infarction received beta-blockers and only 39% of adults with pneumonia received the recommended care (Pneumovax, influenza vaccine, and antibiotics).19
Making matters even more complicated, medical evidence can be inconclusive, contradictory, or just plain wrong. John Ioannidis, a meta-researcher and expert on the credibility of medical research, estimates as much as 90% of published research is flawed. Why? In addition to the normal flaws inherent to medical research, at every step, there is an opportunity to conflate results and a clear intellectual conflict of interest to do so. In the “publish or perish” world of academic medicine, it is the eye-catching findings that get into top journals. Using a mathematical model that builds in even modest amounts of bias, Ioannidis predicted rates of incorrect findings at the rate they were later refuted at 80% for nonrandomized trials and 25% of randomized controlled trials.20
Risk communication
Even when we get the evidence right, clinicians are not well equipped to communicate risks and benefits of treatment choices effectively to patients. Risk communication is critically important to effective patient-centered communication, but the challenge begins at the most basic level. Individuals lack knowledge about health risks; even the risk of heart attack and stroke.21 Being a patient does not necessarily improve one’s knowledge either. A New Zealand study showed that patients’ perceived risk of having a future heart attack was unrelated to age, sex, family history of MI, diabetes, smoking, or several other known heart attack risk factors.22
Risk language
However, improving risk communication requires more than just handing information to patients about risk factors. Edwards et al.23 note the importance of moving beyond the traditional one-way dissemination of information from clinician to patient. They define risk communication as “the open two way exchange of information and opinion about risk, leading to better understanding and better decisions about clinical management”. The “two way” portion is critically important, yet extremely challenging to do in practice.
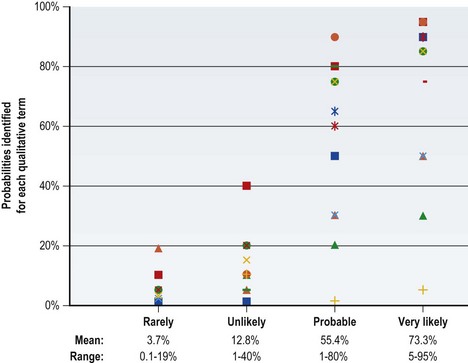
One factor underlying this challenge is that many people (clinicians and patients alike) have low “statistical literacy” (sometimes referred to as low “numeracy”). This term refers to an inability to reason with or understand numbers and other mathematical concepts.24,25 In an attempt to avoid the problems inherent in communicating statistical evidence, qualitative terms often are used. For example, “The risk of infection is ‘rare’ or ‘unlikely’.” But what does “rare” or “unlikely” mean? These terms are “elastic,” in that they convey different meanings to different people under different circumstances.23
Figure 12.2 illustrates the problem with using this qualitative terminology. A group of doctors and administrators were asked the following question: “If you learn that the risk of a side effect from this medication is either rare, unlikely, probable, or very likely, what do you think is the probability (percentage chance) that it will occur? For example, if ‘the risk of a side effect from this medication is certain,’ you might enter 100%.” The figure shows the distribution and range of responses to each of these qualitative terms. Although the lines trend towards more frequent events being assigned higher probabilities, the overlap across categories is considerable even among this very knowledgeable audience. Thus, simplifying language to avoid numbers actually may result in greater miscommunication.

Stay updated, free articles. Join our Telegram channel

Full access? Get Clinical Tree


