DESCRIPTIVE STATISTICS 
 Why use descriptive statistics?
• To describe the basic characteristics of a data set.
• To identify patterns in your data set.
• To generate hypotheses.
 What are common measures of central tendency?
• Mean.
• Median.
• Mode.
 What is the mean?
The statistical average.
 How is the mean estimated?
To estimate the mean, sum up all the values and divide the sum by the number of values.
 What is the median?
The exact “middle” value.
 How is the median determined?
Sort the data from the lowest to the highest value and find the value in the middle. If there is an even number of data points, average the two values in the middle.
 When the data are highly skewed, which measure of central tendency is preferred?
The median because the mean is sensitive to outliers or data points that are very different than most others.
 What is the most frequently occurring score in a set of scores?
The mode.
 Measures of dispersion include?
• Range.
• Standard deviation.
• Standard error.
 What does the standard deviation describe?
• How spread out the values are in a data set, OR
• How closely the values of a data set cluster around the mean value.
 What is the standard error?
The standard error refers to the likelihood that the mean and standard deviation of a specific sample of participants reflect the mean and standard deviation of the full population of potential participants. It is computed by dividing the standard deviation by the square root of the sample size (n).
 What is the range?
The distance between the minimum value and maximum value.
 What is the interquartile range?
The distance between the 25th and 75th percentiles.
 TYPES OF VARIABLES
 What is a categorical variable?
A variable made of categories that cannot be quantified (e.g., blood type, gender, and pregnant/not pregnant).
 What kind of statistical analysis is appropriate for categorical variables?
Nonparametric statistics.
 What is a continuous variable?
A variable that gives a score for each subject in a sample and can take on any value on a measurement scale (e.g., blood pressure and cholesterol).
 What kind of statistical analysis is appropriate for continuous variables?
Parametric statistics.
 What is an ordinal variable?
An ordinal variable is a variable that is recorded on an interval scale from highest to lowest but does not involve use of the numerical relationship between numbers (e.g., having patients rate their level of pain on a scale from 1 to 10).
 What kind of statistical analysis is appropriate for ordinal variables?
Technically, nonparametric statistics are most appropriate for ordinal variables, but researchers often use parametric statistics.
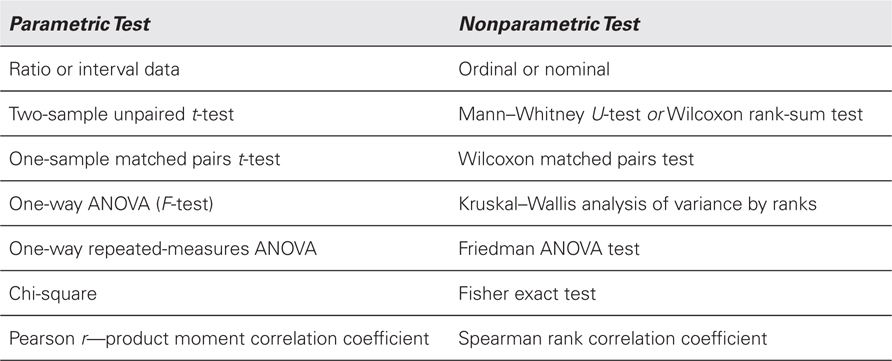
 What is the difference between parametric and nonparametric tests?
Parametric tests assume that the data are normally distributed and nonparametric tests are typically more stringent because they are based on the assumption of nonnormal distribution.
Examples of parametric tests and the nonparametric equivalent
 INFERENTIAL STATISTICS
 The probability that any particular outcome would have occurred by chance is known as?
The P value: the probability of the observed result or something more extreme under the null hypothesis.
 What is a confidence interval?
A range of values around the sample mean within which a researcher can be certain (typically 95% certain) contains the true mean of the population.
 PARAMETRIC TESTS
 What types of analysis can you use when both variables are continuous?
• Regression.
• Correlation.
 What does regression analysis mean?
Whether you can predict the value of one variable (the dependent variable) from the value of another variable (the independent variable) (e.g., predicting a patient’s cholesterol level from the number of years he or she has been smoking).
Related posts:
Stay updated, free articles. Join our Telegram channel

Full access? Get Clinical Tree


