Raman spectroscopy provides a noninvasive bedside tool that captures unique optical signals via molecular vibrations in tissue samples. Raman theory was discovered at the beginning of the twentieth century, but it was not until the past few decades that it has been used to differentiate skin neoplasms. We provide a brief description of Raman spectroscopy for in vivo skin cancer diagnosis, including the physical principles underlying Raman spectroscopy, its advantages, typical spectra of skin pathologies, and its clinical application for aiding skin cancer diagnosis.
Key points
- •
Raman spectroscopy is a noninvasive optical technique that measures the chemical vibrational modes of molecules within tissue.
- •
Raman tissue signals are extremely weak and require specialized spectrometers and optical probes to be detected.
- •
Raman spectroscopy for in vivo clinical applications has been developed as a diagnostic aid for skin cancer.
- •
Recent clinical studies suggest that Raman spectroscopy may potentially be at least comparable or superior to other diagnostic techniques.
Introduction
Skin cancers, including basal cell carcinoma (BCC), squamous cell carcinoma (SCC), and melanoma, are the most common human malignancies. The clinical diagnosis of skin cancers is customarily based on visual inspection followed by invasive biopsy of suspicious lesions. The overall level of accuracy relies heavily on the experience and training of the health care professional. To aid skin cancer diagnosis, several optical techniques have been proposed, including Raman spectroscopy, spectral imaging, optical coherence tomography, and dermoscopy. Raman spectroscopy has now been implemented as a real-time, in vivo tool for use at the bedside, and has been approved in the European Union, Canada, and Australia, but not yet by the US Food and Drug Administration.
What does Raman spectroscopy measure?
What Is the Raman Effect and What Influences It?
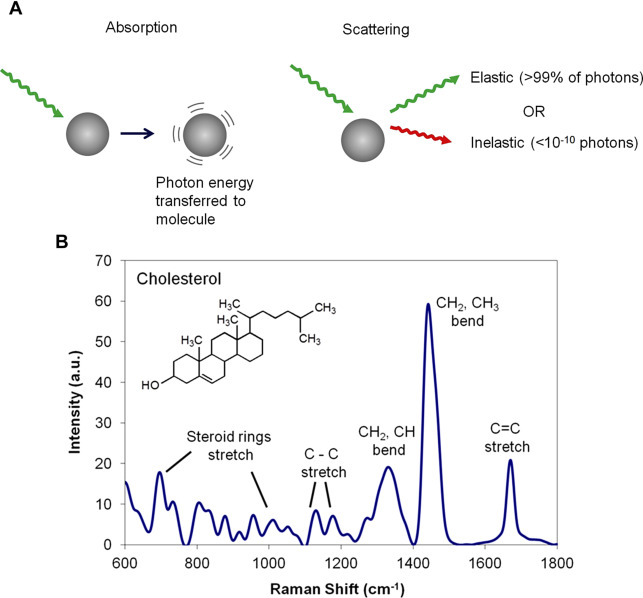
The Raman scattering effect was first discovered experimentally by the Indian physicist, C.V. Raman in 1928, and is related to the chemical vibrational modes of molecules. As shown in Fig. 1 A , almost all of the incoming light photons that reach any molecule are either absorbed or scattered. If a photon is absorbed, its energy is transferred to the molecule, whereas if a photon’s path is scattered by the molecule, its energy is conserved, and this scattering event is thus said to be “ elastic .” A very tiny proportion of scattered photons (∼10 −10 ; ie, 1 of every 10 billion photons) is scattered “ inelastically ,” meaning that the energy of the incident photon changes slightly as its path is scattered by the molecule. This minor energy difference between the incident and inelastically scattered photon is known as the Raman effect (or shift) and this energy corresponds to the unique molecular vibrational levels of the scattering molecule. Because photon energy is inversely related to wavelength, the Raman shift also will manifest as a slight color shift for the scattered photon; this color shift requires a highly sensitive spectrometer to detect.
In physics, Raman scattering is governed by several selection rules that are related to molecular vibrations, including symmetric stretching, asymmetric stretching, bending, rocking, wagging, and scissoring. These modes involve energy levels corresponding to that of infrared (IR) radiation, and the Raman shift for a molecule is thus related, but not identical to its IR absorption spectrum. Raman spectroscopy and IR absorption spectroscopy are complementary, but for in vivo tissue measurements, Raman spectroscopy is superior to IR absorption spectroscopy. The preferred measurement geometry for IR absorption spectroscopy is a transmission configuration, which is inconvenient or impossible to implement for in vivo applications. In contrast, Raman spectroscopy facilitates a backscattering/reflection measurement geometry that is ideally suited for in vivo applications. Another practical issue is that the high water content of in vivo tissue exhibits strong IR absorption that overwhelms the IR absorption spectral features of other tissue molecules. Raman spectroscopy shifts the spectral measurements to the visible or near IR wavelength range, which is minimally affected by the presence of water.
As shown in Fig. 1 B, a Raman spectrum is commonly expressed in intensity as a function of Raman shift, given by v = 1/λ 0 -1/λ, where λ and λ 0 are the wavelengths of the Raman signal and the excitation light respectively; v is the Raman shift in wavenumbers (cm −1 ), which usually ranges up to 4000 wavenumbers (ie, cm −1 ). The range below 2000 cm −1 is often called the fingerprint region, where the Raman signal is abundant and unique for most biological molecules. The region above 2000 cm −1 is often called the high-frequency region, consisting of Raman peaks mainly from lipids, proteins, and water. The Raman shift in wavenumbers is an absolute energy difference between the Raman signal and the incident light. To the extent that diseased tissue exhibits differences in molecular composition as compared with normal tissue, Raman spectra will vary between pathologic and healthy states.
Although the existence of the Raman effect has been known since the early twentieth century, the ability to detect these extremely weak, but highly informative optical signals from tissue has only recently been technically feasible.
What Information Does Raman Provide?
Raman signals are highly dependent on the structure and conformation of biochemical constituents at the molecular level, and therefore are regarded as molecular fingerprints. The Raman shift of a peak indicates a specific vibrational mode within a specific molecule. The Raman intensities of various peaks correspond to the quantity of the molecules within the sample. Therefore, one can quantify and characterize molecules by measuring their Raman intensities and shifts from the recorded spectra.
How does Raman scattering differ from other optical methods for diagnosis; that is, reflectance, fluorescence, optical coherence gating, and confocal techniques?
There are 3 basic light-tissue interactions, including absorption, scattering (elastic and inelastic), and fluorescence. All optical methods involving spectroscopy and/or imaging are based on 1 or more of these interactions. Raman is based on the inelastic scattering effect, which is more specific at the molecular level than other techniques. Absorbers (ie, chromophores), scatterers, and fluorophores within skin tissue include the following:
- •
Skin chromophores include structural proteins and nucleic acids in the UV range; melanin, hemoglobin, and bilirubin in the visible range; and water and fat in the infrared range.
- •
Elastic optical scattering is mainly caused by refractive index fluctuations. The main elastic scatters in skin include interfaces of cell membranes, nuclei, and collagen fibers.
- •
Most skin molecules cause inelastic (Raman) optical scattering, such as all types of amino acids, proteins, lipids, and nucleic acids.
- •
Skin (endogenous) fluorophores include tryptophan, porphyrins, collagen fibers, elastic fibers, keratin fibers, flavins, and nicotinamide adenine dinucleotide.
The most commonly used spectroscopic techniques involve reflectance, fluorescence, or Raman scattering, and are based on recording these optical effects as a function of wavelength. Clinical spectroscopic devices typically assess specific points within tissue, and spectroscopic approaches are usually faster than their imaging counterparts.
Optical imaging techniques can also use reflectance, fluorescence, or Raman scattering to quantify the spatial distribution of these interactions at a specified wavelength or waveband region. For example, standard digital photography records the spatial distribution of elastic scattering and/or absorption by the skin within the visible wavelength range. Dermoscopy is essentially magnified digital imaging with higher resolution than regular digital imaging. When combined with other techniques, these spectroscopic or imaging techniques can be further refined into different modalities, such as reflectance confocal microscopy, which combines confocal detection with ballistic reflection (ie, single elastic scattering events); optical coherence tomography, which combines coherent gating detection with ballistic reflection; and spectral imaging, which incorporates integrated spectral and spatial information. A brief comparison of these techniques is summarized in Table 1 .
| Techniques | Advantages | Disadvantages |
|---|---|---|
| Dermoscopy |
|
|
| Raman spectroscopy |
|
|
| Reflectance spectroscopy |
|
|
| Fluorescence spectroscopy |
|
|
| Reflectance confocal microscopy |
|
|
| Optical coherence tomography |
|
|
| Spectral imaging |
|
|
| Raman imaging |
|
|
Related posts:
 Clinical Diagnosis of Skin Cancer
Enhancing Skin Cancer Diagnosis with Dermoscopy
Electrical Impedance Spectroscopy in Skin Cancer Diagnosis
Proteomic Mass Spectrometry Imaging for Skin Cancer Diagnosis
Smartphone-Based Applications for Skin Monitoring and Melanoma Detection
Teledermatology Applications in Skin Cancer Diagnosis
Clinical Diagnosis of Skin Cancer
Enhancing Skin Cancer Diagnosis with Dermoscopy
Electrical Impedance Spectroscopy in Skin Cancer Diagnosis
Proteomic Mass Spectrometry Imaging for Skin Cancer Diagnosis
Smartphone-Based Applications for Skin Monitoring and Melanoma Detection
Teledermatology Applications in Skin Cancer Diagnosis
Stay updated, free articles. Join our Telegram channel

Full access? Get Clinical Tree


