In the 1940s, Winsor and Burch (1944) showed, by sandpapering the skin surface, that the skin’s barrier actually resides in the epidermal horny layer. Until then it had been thought that the horny layer’s only function was to protect the body from physical and chemical injury by virtue of its toughness. It now became clear that it also was responsible for the maintenance of body homeostasis. In the 1950s and 1960s, Berenson and Burch (1951) and Onken and Moyer (1963) showed that horny layer impermeability essentially was a function of its lipid content, and Brody (1966) managed to locate the horny layer lipids to the extracellular space.
The first EM visualizations of the lipid material’s stacked lamellar morphology came with Breathnach et al. (1973) and Elias and Friend (1975) in the early 1970s. Then, trying to determine the molecular composition and organization of this lipid material became the subject of much activity.
Determining the lipid composition was difficult, as contamination sources were numerous and the amount of contaminating lipid normally was large in comparison with the amount of actual horny layer lipids studied. The problem was approached by studying young pigs with inactive sebaceous glands (Wertz and Downing 1983), and by studying human epidermal cysts that could be collected without contamination (Wertz et al. 1987).
The introduction of ruthenium tetroxide staining in the mid 1980s revealed the lipid material’s characteristic broad: narrow: broad electron lucent band staining pattern (Madison et al. 1987).
Soon afterward, using small-angle X-ray diffraction on isolated horny layer, White et al. (1988), Garson et al. (1991) and Bouwstra et al. (1991) reported the presence of one shorter (ca 4.5 nm) and one longer (ca 6.5 nm) diffraction peak related to lipids. Also, McIntosh (2003) observed an asymmetric distribution of cholesterol molecules within model systems composed of extracted horny layer lipids.
In the early 1990s, the importance of the lipid material’s phase state for its barrier properties began to be stressed (Forslind 1994). In 2001, Norlén proposed that the lipid material exists as a single and coherent gel phase (Norlén 2001b), which was later supported by the experimental work of Iwai et al. (2012).
In 2012, Iwai et al. showed experimentally that the horny layer’s lipid material is organized as stacked bilayers of fully extended ceramides with cholesterol molecules associated with the ceramide sphingoid moiety (Figs. 3.2 and 3.3).
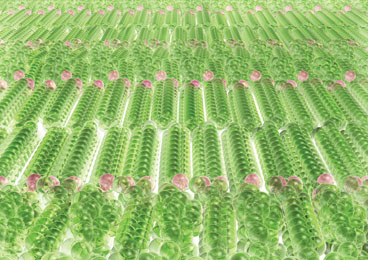
Fig. 3.2
Molecular arrangement of the skin barrier. The horny layer’s lipid material is organized as stacked bilayers of fully extended ceramides with cholesterol molecules associated with the ceramide sphingoid moiety (Iwai et al. 2012). Green spheres represent hydrogen and carbon atoms in ceramides, cholesterol, and free fatty acids. Red spheres represent oxygen atoms. Adapted from Norlén (2013), with permission
Fig. 3.3
Schematic drawing of skin. Left part: schematic cellular-scale drawing of epidermis. Mid part: molecular-scale drawing of the lamellar lipid material occupying the space between the cells of the horny layer. Right part: atomic model of the lipid material’s repeating unit, composed of two mirrored subunits, each composed of one fully extended ceramide (CER), one cholesterol (CHOL), and one free fatty acid (FFA) molecule. Adapted from Norlén (2012), with permission
Skin Lipid Composition and Phase State
Essential for determining the lipid material’s molecular organization and physical properties was to obtain an idea of its molecular composition. This was difficult given the contamination sources and the horny layer’s morphological complexity, where extracted horny layer lipids are derived not only from the extracellular lipid material but also from the cell plasma membrane (also termed corneocyte “lipid envelope”), and possibly also from intracellular sources. However, by minimizing contamination sources and by comparing the experimental and interindividual variability between different extracted lipid fractions, a consensus was eventually reached with respect to the rough molecular composition of the horny layer’s lipid material (Wertz and Norlén 2003).
The lipid material consists of a heterogeneous mixture of saturated, long-chain ceramides, free fatty acids, and cholesterol in a roughly 1:1:1 molar ratio (Wertz and Norlén 2003). More than 300 different species have been identified in the ceramide fraction alone (Masukawa et al. 2009).
The most characteristic features of the lipid composition (Wertz and Norlén 2003) are (i) extensive compositional heterogeneity with broad, but invariable, chain length distributions (20–32 C; peaking at 24 C) in the ceramide fatty acid and free fatty acid fractions, (ii) almost complete dominance of saturated very long hydrocarbon chains (C20:0–C32:0), and (iii) large relative amounts of cholesterol (about 30 mol %).
These are the same as the factors that typically stabilize lipid gel phases. It has therefore been proposed that the horny layer’s lipid material exists as a single and coherent gel phase (Norlén 2001b). The viscous gel-like behavior of the lipid material was recently demonstrated experimentally by its remarkable malleability in situ (Fig. 3.4; Iwai et al. 2012).
Fig. 3.4
The horny layer’s lipid material is, despite its crystalline-like character, malleable. The horny layer’s extracellular lipid material is folded locally. The folding decreases on hydration and increases on dehydration. Low magnification CEMOVIS micrographs of the horny layer after hydration in vivo (a), at normal in vivo conditions (b), and after hydration in vivo followed by dehydration ex vivo (c). The lower panel illustrates the folded pattern of the extracellular space. Image side lengths: 5 µm. Adapted from Iwai et al. (2012) (online suppl. material), with permission
Molecular Structure Determination Directly In Situ
Recently, the lipid material’s molecular organization was determined with the aid of high-resolution CEMOVIS (Iwai et al. 2012). This technique yields high-resolution images of the horny layer’s lipid material in situ and in its near native state. When combined with molecular modeling and EM simulation, CEMOVIS has proved to be remarkably effective in identifying the molecular organization of the horny layer lipids.
A short description of the new experimental procedure is provided in the following section, which could also be generalized to determine the molecular organization of other biomolecular structures in skin, such as the corneocyte keratin network and the corneocyte lipid envelope. For a more detailed description, see Norlén et al. (2014).
The Procedure
The structure determination procedure involves four stages (Norlén et al. 2014): CEMOVIS to yield high resolution (ca 1 nm) images of the lipid material (Fig. 3.5); construction of candidate molecular models for the lipid material (Fig. 3.6); simulation of electron micrographs resulting from the proposed molecular models (Fig. 3.6); and confrontation of the simulated micrographs with those observed experimentally to identify a molecular organization that is consistent with the observed CEMOVIS data (Fig. 3.7).
Fig. 3.5
The CEMOVIS intensity pattern of the horny layer’s extracellular lipid material consists of folded stacked layers. a Medium magnification CEMOVIS micrograph of the interface between two cells in the midpart of the horny layer. Note that in CEMOVIS, the tissue is unstained, and that the pixel intensity is directly related to the local electron density of the sample. The stacked lamellar pattern represents the extracellular lipid material. Dark ~ 10 nm dots represent keratin intermediate filaments filling out the intracellular space. b High magnification CEMOVIS micrograph of the extracellular space in the midpart of the horny layer. The averaged intensity profile of the lipid material was obtained by fuzzy distance-based image analysis. The red stars in b represent the manually chosen start and end points for fuzzy distance based path growing. c The red line represents the traced out path. Stacked lines mark extracted intensity profiles. d Enlarged area of the central part of b. e Reversed averaged pixel intensity profile obtained from the extracted area in c. Peaks in e correspond to dark bands and valleys to lucent bands in d. Black arrows in b denote electron lucent narrow bands at the centre of the 6.5 nm bands. Section thickness ~ 50 nm (a–d). Scale bar a: 100 nm. Pixel size in (a–d): 6.02 Å. Adapted from Iwai et al. (2012), with permission
Fig. 3.6
Electron microscopy (EM) simulation of the horny layer’s extracellular lipid material. a High magnification CEMOVIS micrograph of the extracellular space in the midpart of the horny layer. b Corresponding averaged intensity profile obtained by fuzzy distance based path growing (cf. Fig. 3.1b, c). c Schematic 2D illustration of ceramides (tetracosanylphytosphingosine (C24:0)) in fully extended conformation with cholesterol associated with the ceramide sphingoid part and free fatty acids (lignoceric acid (C24:0)) associated with the ceramide fatty acid part. d Atomic 3D model of the repeating unit composed of two mirrored subunits, each composed of one fully extended ceramide, one cholesterol and one free fatty acid molecule. e Calculated electron scattering potential of one model subunit. f Calculated electron scattering potential 3D maps of the topmost layer out of 20 superimposed layers used to generate the simulated electron micrograph g. Defocus (a, g): − 2.5 µm. Pixel size in (a, g): 3.31 Å. Adapted from Iwai et al. (2012), with permission
Fig. 3.7


Electron microscopy (EM) simulation of alternating fully extended ceramides with selective localization of cholesterol to the ceramide sphingoid part accurately accounts for the observed CEMOVIS intensity patterns as well as for the interference pattern changes observed in sequential CEMOVIS micrograph defocus-series obtained at very high magnification (≤ 1.88 Å pixel size). (a–c) High magnification CEMOVIS micrographs (first exposition images) of the extracellular space in the midpart of the horny layer obtained at − 0.5 µm (a), − 2 µm (b), and − 5 µm (c) defocus. At very low defocuses (− 0.5 µm) (a) CEMOVIS intensity patterns can only be observed at very high magnification (≤ 1.88 Å pixel size). At very high defocuses (− 5 µm) (c) image resolution is low but still allows for resolution of the ~ 11 nm repeating unit. The slightly larger lamellar repeat distance in (b) (~ 12 nm) compared to a and c (~ 11 nm) may be due to more pronounced compression of the vitreous skin section during cryo-sectioning along the lamellar plane in (b) compared to in (a) and in (c). (d–e) represents corresponding atomic 3D model (cf. Fig. 3.3 right part; Fig. 3.6d) EM simulation images recorded at − 0.5 µm (d), − 2 µm (e) and − 5 µm (f) defocus. (g–i) sequential CEMOVIS micrograph defocus-series obtained at very high magnification (1.88 Å pixel size). Note the fine changes in interference patterns caused by gradually increasing the microscope’s defocus during repeated image acquisition at a fixed position. Due to electron beam damage after repeated electron exposure, the image contrast is lower in micrographs (h–i) compared to micrograph (g), which was acquired first. In micrograph (i) some shrinkage can be observed. This is probably due to mass loss during repeated electron exposure. Also, the curvature of the lamellar pattern is slightly increased in micrographs (h–i) compared to in micrograph (g), which likewise may be caused by nonhomogeneous mass loss during repeated electron exposure. (j–l) represents corresponding atomic 3D model (cf. Fig. 3.3 right part; Fig. 3.6D) EM simulation images recorded at − 1 µm (j), − 2 µm (k), and − 3 µm (l) defocus. It is shown that the atomic 3D model in Fig. 3.5 accurately accounts not only for the major features of the CEMOVIS micrographs (a–f) but also for the interference intensity pattern changes observed upon varying the microscope’s defocus during image acquisition at very high magnification (g–l). Pixel size in (c, f): 3.31 Å, in (b, e): 6.02 Å, and in (a, d, and g–l): 1.88 Å. Adapted from Iwai et al. (2012), with permission
Related posts:

Stay updated, free articles. Join our Telegram channel
Full access? Get Clinical Tree
