Normal lymphoscintigram
Abnormal lymphoscintigram
p
n
31
20
Female
26
12
Male
5
8
Age
54
54
Body mass index (mean)
39
65
<0.0001
Diabetes
2
5
0.1
Heart failure
1
0
1
Hypercholesterolemia
4
0
0.15
Hypertension
12
12
0.16
Venous insufficiency
2
0
0.51
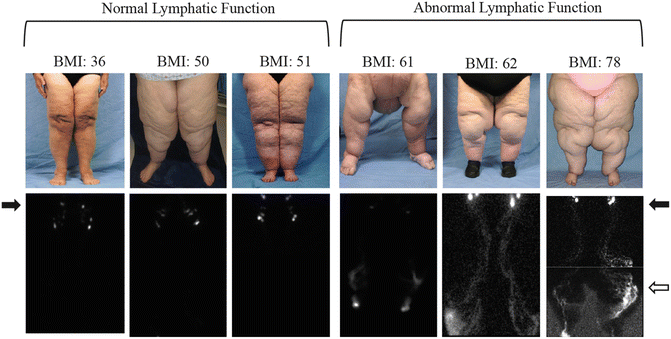
Two cohorts of patients with obesity-induced lymphedema exist: (1) individuals who do not have a history of significant weight loss and are at their maximum BMI at the time of the lymphoscintigram (Table 9.2) and (2) subjects with a history of massive weight loss following a bariatric surgical procedure or dieting and are not at their maximum BMI at the time of lymphoscintigram (Table 9.3). Patients without a history of weight loss who have lymphedema have a greater BMI [72.9 (range, 54.1–83.3)] compared to individuals without lymphedema [37.7 (range, 30.3–55.8)] (p < 0.0001) [6]. In these patients a BMI threshold between 50 and 60 exists at which point lymphatic dysfunction occurs. All subjects with a BMI <50 had normal lymphatic function and every person with a BMI >60 had lymphatic dysfunction. Individuals with a BMI between 50 and 60 had either normal or abnormal lymphatic function (Fig. 9.1) [6].

Table 9.2
Cohort of obese patients at their maximum BMI at time of lymphoscintigraphy (n = 33)
Normal lymphoscintigram | Abnormal lymphoscintigram | p | |
|---|---|---|---|
n | 22 | 11 | |
Female | 19 | 6 | |
Male | 3 | 5 | |
Age | 53.3 years (range, 14–86) | 55.0 years (range, 30–73) | |
Body mass index | 37.7 (range, 30.0–55.8) | 72.0 (range, 54.1–83.3) | <0.0001 |
Table 9.3
Cohort of obese patients with a history of weight loss and not at their maximum BMI at time of lymphoscintigraphy (n = 18)
Normal lymphoscintigram | Abnormal lymphoscintigram | p | |
|---|---|---|---|
n | 9 | 9 | |
Female | 7 | 6 | |
Male | 2 | 3 | |
Age | 54.0 years (range, 34–63) | 54.0 years (range, 35–71) | |
Maximum body mass index | 63.1 (range, 44.3–85.4) | 78.6 (range, 60.4–105.6) | 0.03 |
Current body mass index | 41.6 (range, 30.0–53.1) | 56.1 (range, 43.9–73.3) | 0.005 |
Body mass index change | 20.1 (range, 5.3–36.2) | 22.5 (range, 4.4–45.2) | 0.7 |

Fig. 9.1
Increasing BMI causes lower extremity lymphatic dysfunction. Patients without a history of massive weight loss and a BMI <50 have normal lower extremity lymphatic function. Individuals with a BMI >60 have abnormal findings on lymphoscintigraphy consistent with lymphedema. A BMI threshold exists between 50 and 60 at which point lymphatic dysfunction occurs. Patients on the left with a normal lymphoscintigram exhibit inguinal lymph node uptake of technetium Tc-99m sulfur colloid 45 min after injection into the feet. Subjects on the right with an abnormal lymphoscintigram illustrate delayed transport of tracer and/or dermal backflow on 3 h images. Black arrows identify inguinal lymph nodes, and the white arrow marks dermal backflow. With permission from Greene AK, Grant F, Slavin SA, Maclellan RA. Obesity-induced lymphedema: clinical and lymphoscintigraphic features. Plast Reconstr Surg (in press)
Patients who have lost significant weight prior to their lymphoscintigram have more variable findings compared to the homogenous group without a history of weight loss. Individuals who have lost weight and have abnormal lymphoscintigraphy findings have a greater historical BMI (78.6; p


Stay updated, free articles. Join our Telegram channel

Full access? Get Clinical Tree


