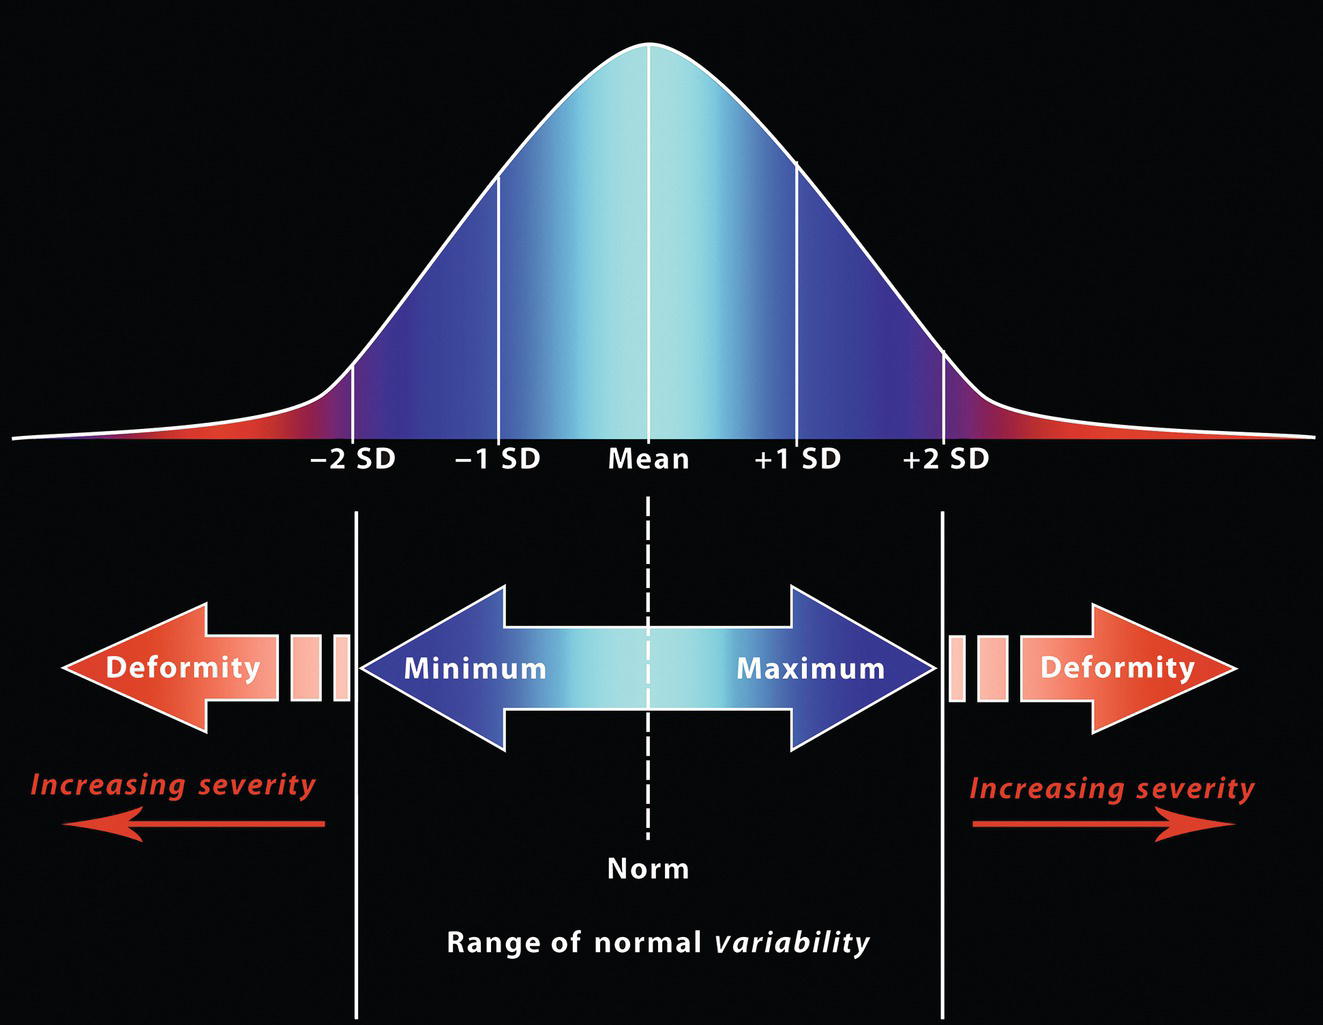
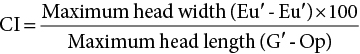
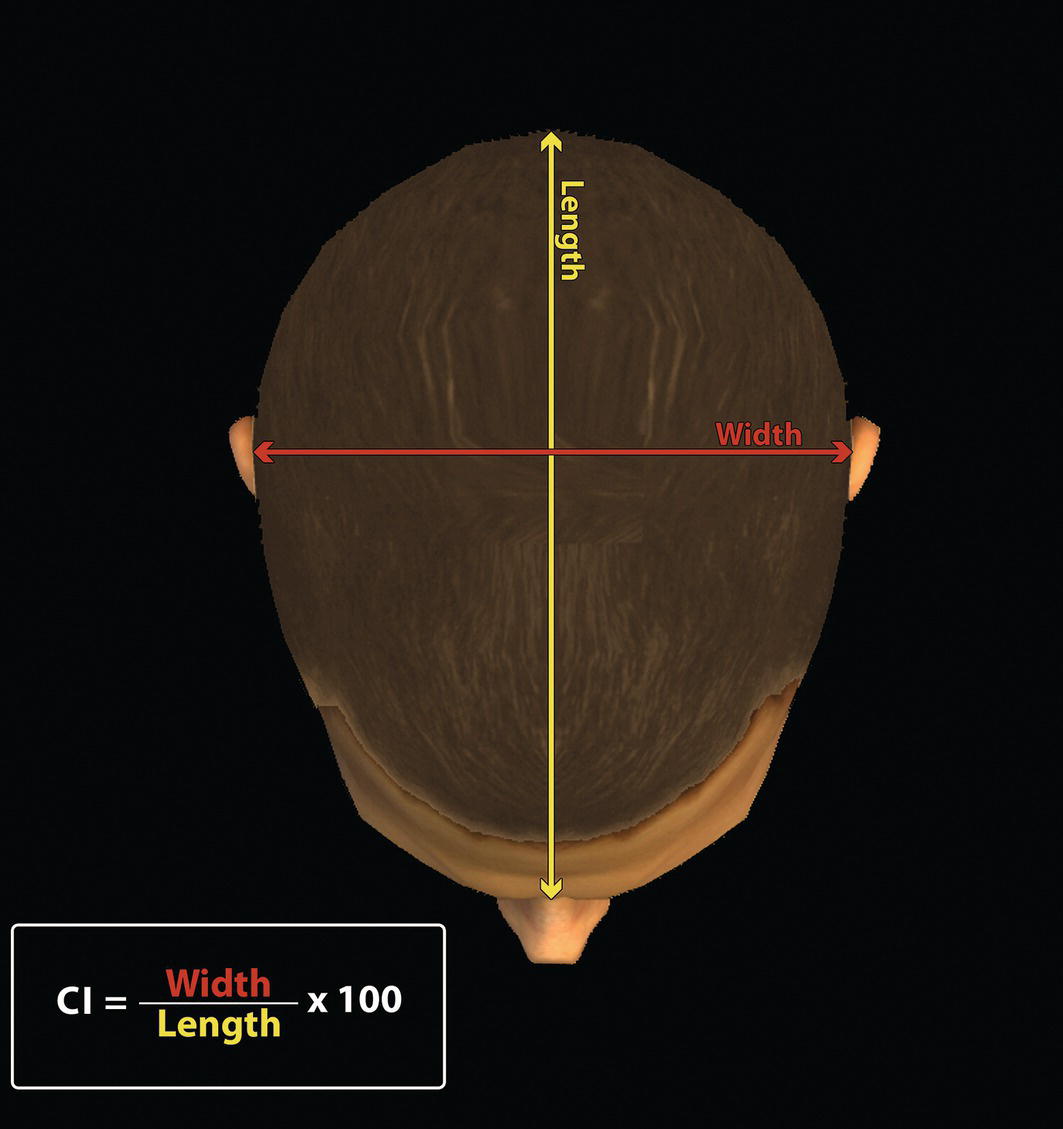
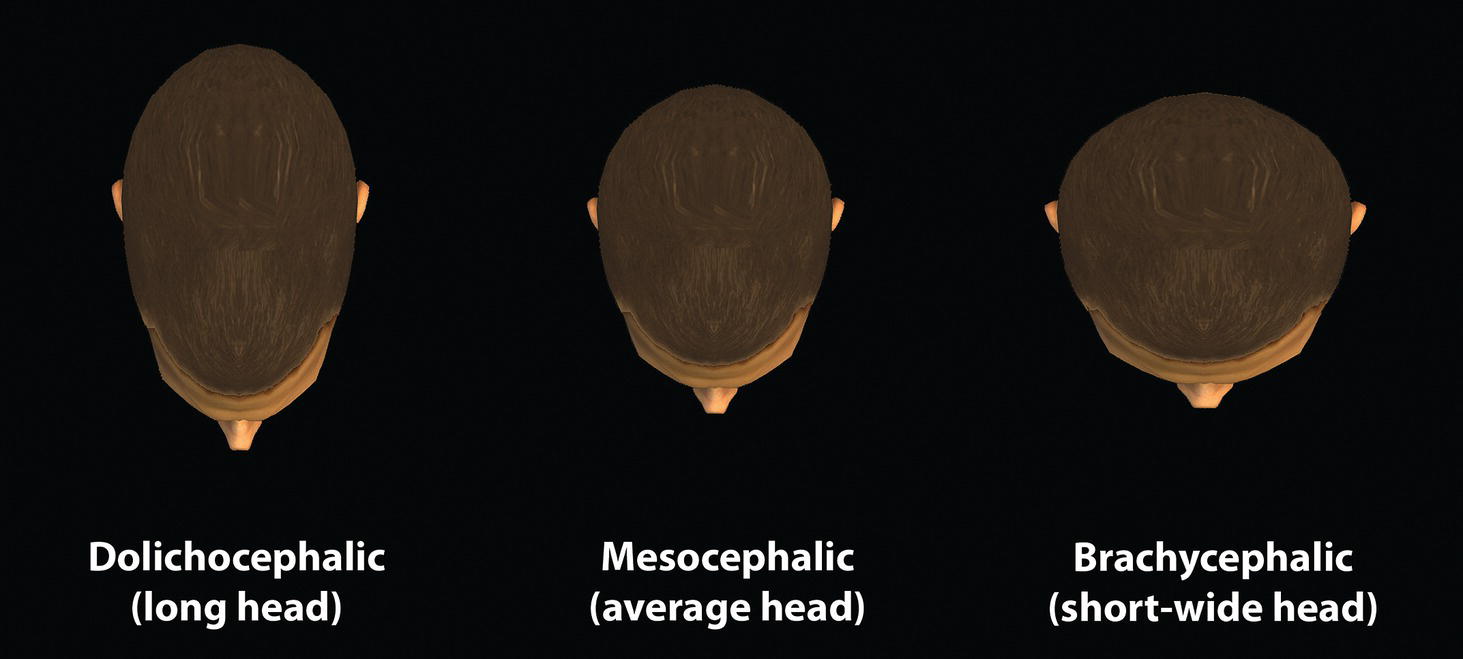
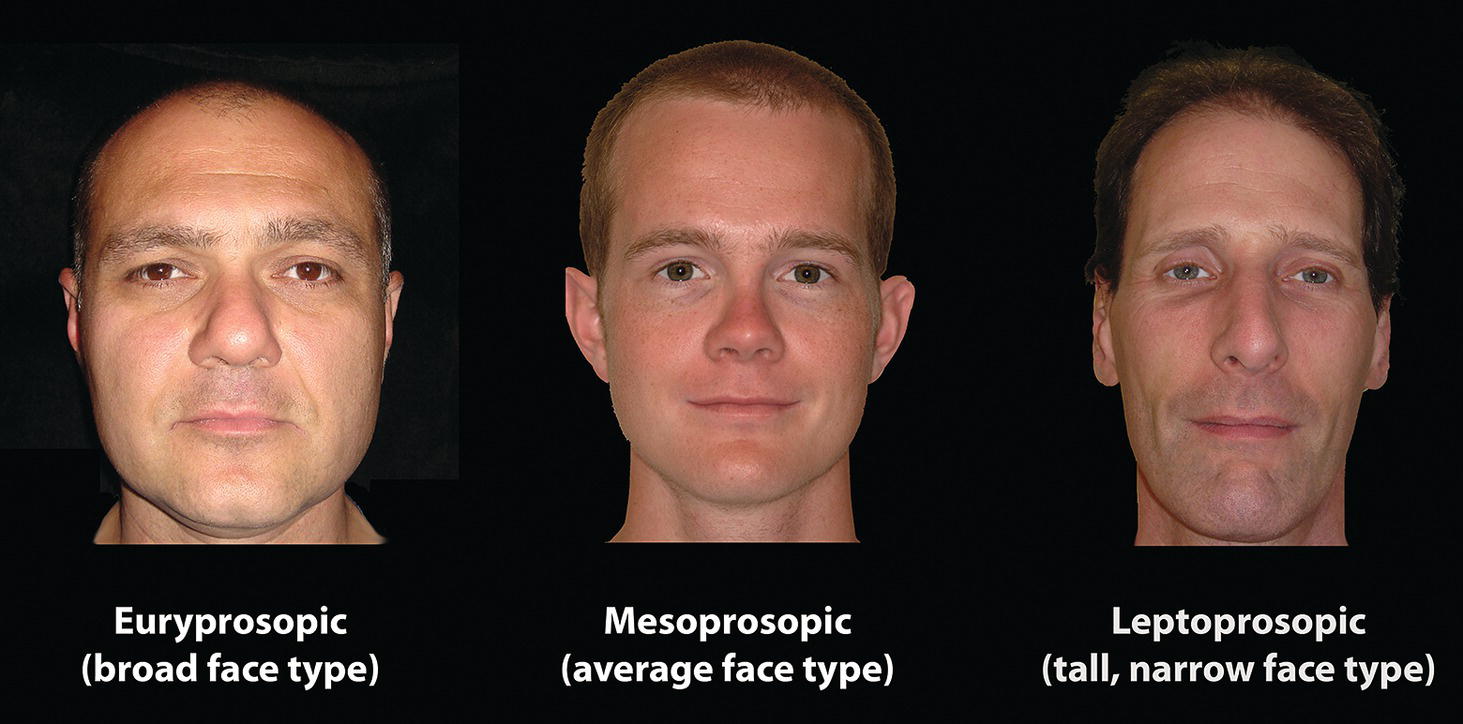
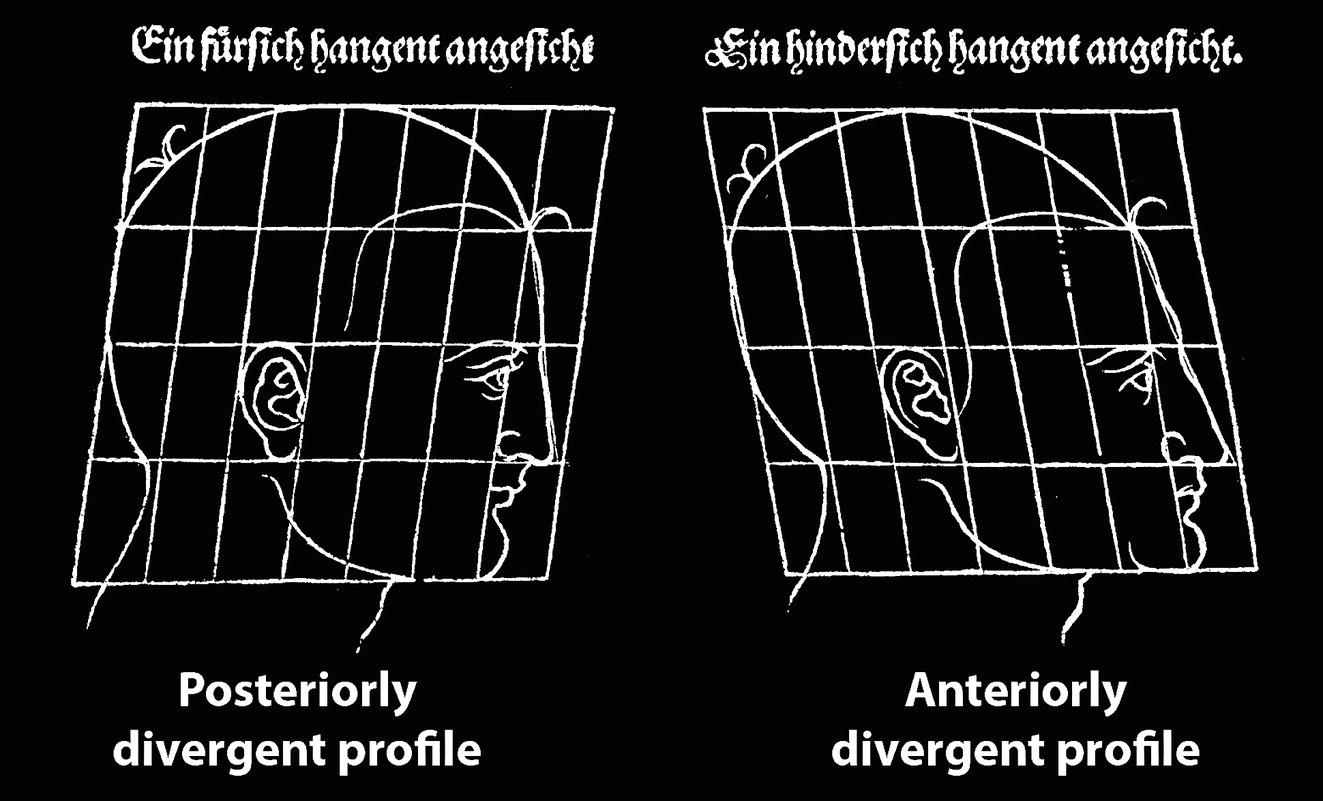
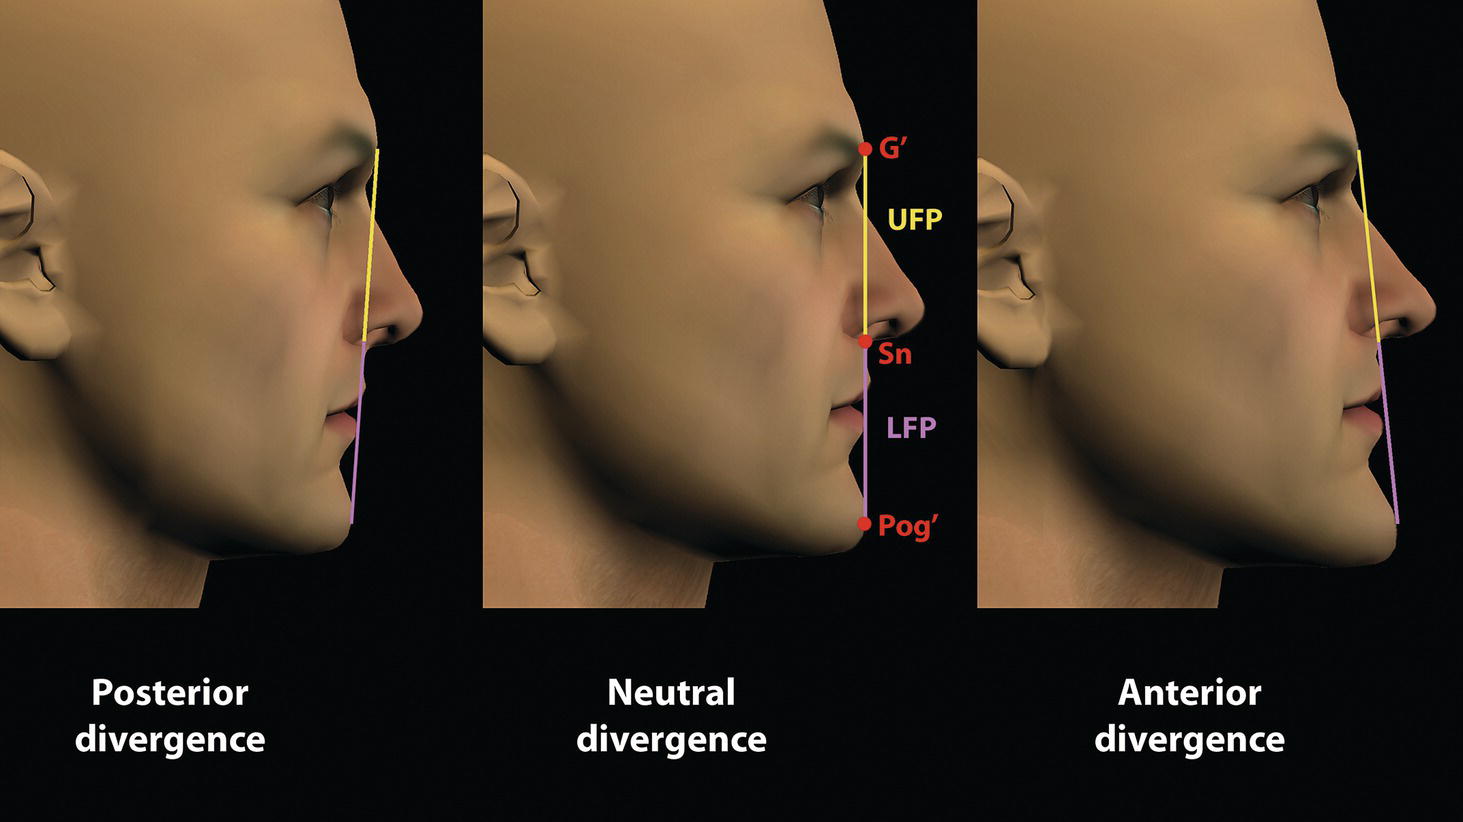
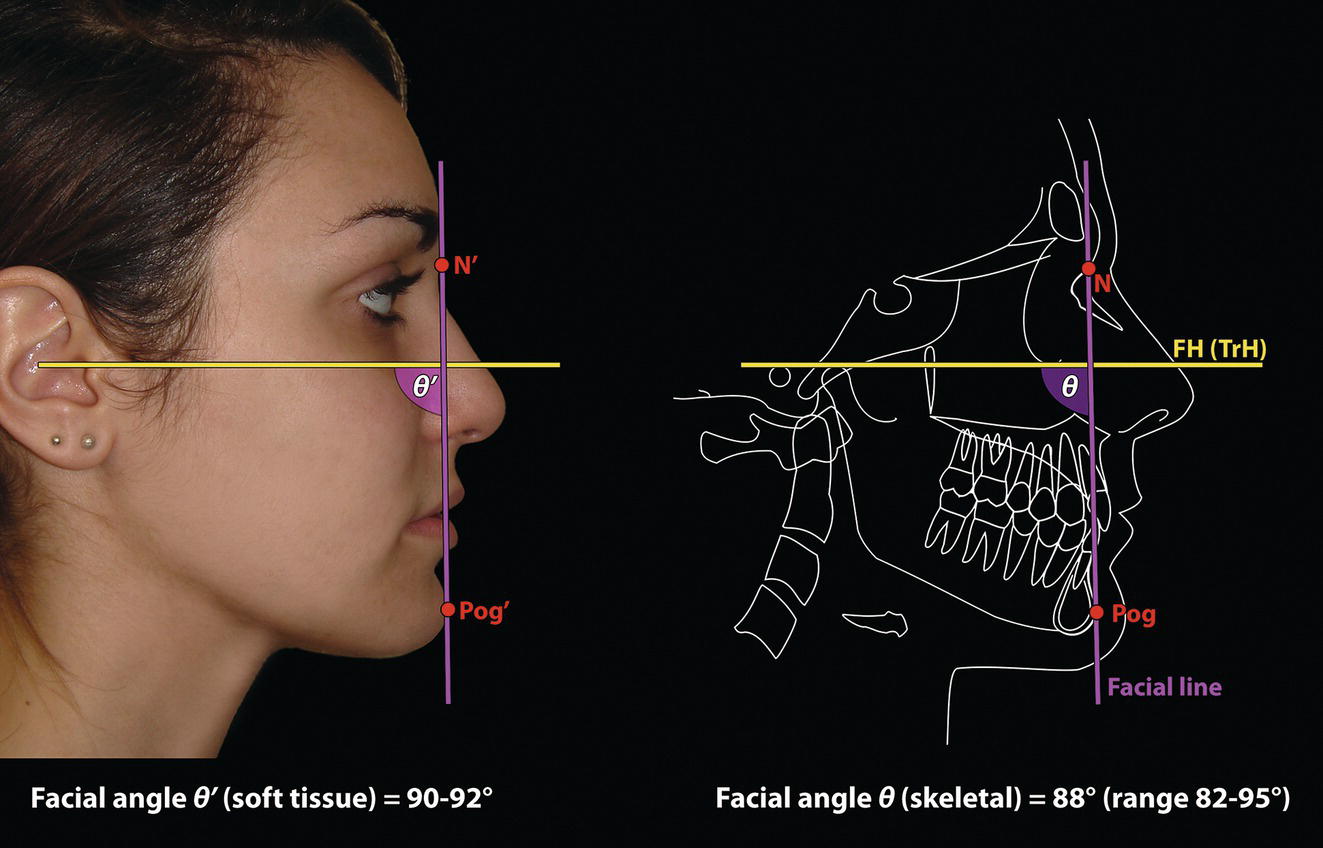
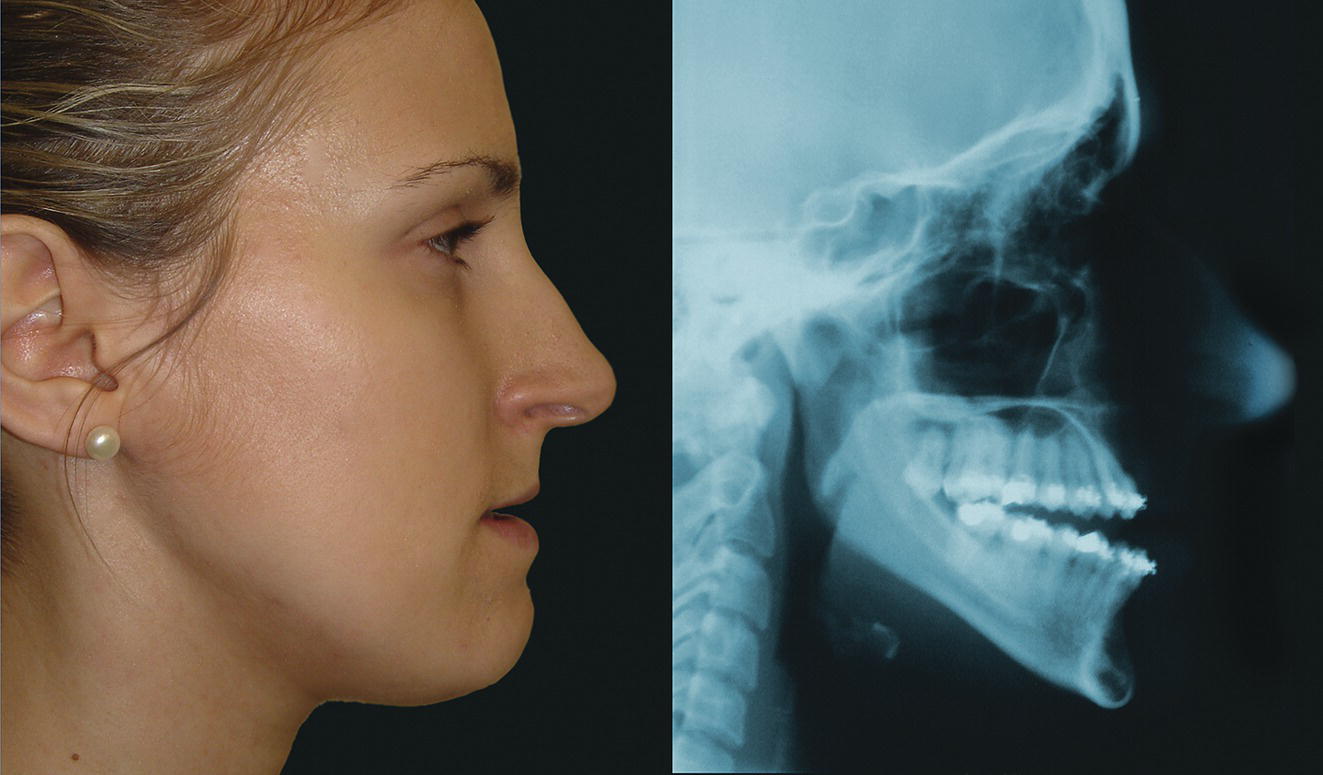
‘It is the common wonder of all men, how among so many millions of faces, there should be none alike’. Sir Thomas Browne (1605–82), English physician and writer, Religio Medici (1643)1 Individual variability is a fundamental principle in human biology. One of the most variable and distinguishable parts of the human body is the craniofacial complex. Clinicians will often compare a patient’s craniofacial measurements and proportions to the so‐called population norms (normative values) or even to classical ideals. However, Simon (1926) stated: ‘all we ever find are variations; an exact, ideal normal does not exist, cannot exist. And this is our enigma; in theory we will never find the normal, in practice we forever feel its need and apply it constantly’.2 The use of population norms may be logically enhanced by evaluating normal ranges of variability. Therefore, clinicians must have a thorough understanding of the normal ranges of variability in every aspect of craniofacial form, depending on age, sex and ethnic variability. Developmental disorders, as well as traumatic injuries and pathological conditions, may lead to deformities of the head and the face. Therefore, clinicians need to have a thorough understanding of the normal anatomy and morphological range of variation of the craniofacial complex in both males and females of different ages and ethnic groups, to act as guidelines when treatment planning the restoration of normal craniofacial proportions. Classifications that are useful for descriptive purposes include: A proportion index provides a numerical expression of the proportionality of a region of the craniofacial complex. The use of proportion indices dates back through the history of craniometry, particularly in the late nineteenth century. Linear (chord) or surface (arc) distances of the skull were measured between a variety of defined craniofacial landmarks; with any two measurements, the smaller was expressed as a percentage of the larger in order to provide a proportion index value. These could be used to provide an indication of skull shape. Figure 8.1 Determination of the normality or abnormality of any craniofacial measurement (or proportion index value) obtained from patients may be evaluated by comparison with the normative values obtained from a normal (average representative) population sample. The normal range of measurements is provided by the mean ±2 standard deviations (SD). The shape of the normal distribution curve shown is determined by the population standard deviation. Craniofacial parameters with small SDs have narrow, taller curves and those with large SDs have broader, flatter curves. Approximately 68% of all values fall within the range of ±1 SD from the mean and 95% within the range of ±2 SD from the mean. The normal range of variability for any craniofacial parameter is taken as being equal to the mean ±2 SDs. Greater differences may be perceived as deformities of gradually increasing severity. The leading researcher in the field of craniofacial anthropometry from the mid‐1960s to the early 2000s was Leslie Farkas, from the University of Toronto. Farkas et al. collected a large quantity of highly relevant anthropometric data between 1968 and 1984, from 2564 individuals.3 These data were used to provide 166 individual facial ratios, presented as proportion indices. In the creation of an index, the smaller measurement is multiplied by 100 (numerator) and divided by the larger measurement (denominator). Thus, a proportion index involves two linear craniofacial anthropometric measurements, with the smaller being expressed as a percentage of the larger. Proportion indices permit objective, quantitative assessment of facial morphology and proportions. Farkas3 identified two basic categories of proportion indices: Each proportion index will have a mean index value and a range of variation for a given population group, based on age, sex and ethnicity. The standard deviation (SD) determines the normal (average) range of variability of an index, from 2 SD below to 2 SD above the mean. Index values within this normal range are regarded as variations of normal proportions.4 Measurements within ±1 SD of the mean are regarded as optimal. The relationship between two measurements is disproportionate if the proportion index value is outside the normal range (Figure 8.1).4 For a number of facial parameters, single morphological measurements or proportion index values may have a large SD and, therefore, wide normal ranges of variation; as such, only measurements or proportion index values which differ considerably from the mean of the population will be perceived as deformities. Conversely, other facial parameters may have very small normal ranges of variability, in which case even a small difference from the mean may be perceived as a deformity. The cephalic index (index cephalicus) is a numerical expression of the ratio between the head width (biparietal diameter) and head length (fronto‐occipital diameter) of a living person. The cephalic index (CI) is calculated by the formula (Figure 8.2): Figure 8.2 Cephalic index. Where: The cephalic index is used in anthropometry to classify head types as (Table 8.1; Figure 8.3): Table 8.1 Classification of anatomical head types Index values according to Martin and Saller.5 Figure 8.3 Head types. The highest cephalic index values occur in the Chinese and the lowest values in African Americans. The larger index values of the Chinese differ significantly from those of whites or blacks (Table 8.2).6 A comparison of the cephalic index values of three ethnic groups was undertaken; North American Caucasians, northern European (German) and eastern European (Czech). The index values indicated a mesocephalic head type for both sexes of North American Caucasians and northern Europeans; and a brachycephalic (short‐wide) head type for the eastern Europeans.6 The head circumference is measured in the horizontal plane around the head, through the glabella and opisthocranion. However, it may be measured across ophyron (the point ‘On’, in the mid‐sagittal plane, of a line tangent to the upper limits of the eyebrows) rather than glabella in order to eliminate the effect of development of the frontal sinuses and superior orbital rims on head circumference.5,7 African Americans have the largest and the Chinese have the smallest head circumference for both sexes. The head circumference is slightly larger for blacks than for whites for both sexes.6 The initial step in facial analysis involves the examination of the face in frontal view in order to assess the overall facial shape. The variety of facial shapes is almost limitless. However, a simple assessment will allow an overall categorization of the basic facial shape. The basic facial shape in frontal view may be any combination of the following: Table 8.2 Cephalic index of three ethnic groups Data modified from Farkas.6 SD = standard deviation. Table 8.3 Head circumference of three ethnic groups Data modified from Farkas.6 SD, standard deviation. Figure 8.4 Facial height‐to‐width ratios. Variations in facial height and width result in an innumerable variety of the three basic facial shapes (round, square and triangular). For example, an oval facial type is a combination of an overall round face combined with increased vertical facial height and/or reduced facial width. The relationship of vertical facial height to facial width is an important indicator of overall facial shape. There are three methods of evaluating the vertical facial height‐to‐width proportion. These may be presented as proportions, percentages or indices: The facial index (index facialis or index of the morphological face height) is a numerical expression of the ratio between the facial height (nasion to menton) and the bizygomatic facial width (zygion to zygion) of a living person. The facial index (FI) is calculated by the formula: Where: The facial index is used in anthropometry to classify faces as (Table 8.4; Figure 8.6): Figure 8.5 Facial types according to Albrecht Dürer. (Modified from Dürer, 15288.) Figure 8.6 Facial types. Table 8.4 Classification of anatomical face types Index values: male according to Garson, 1885;9 and female according to Martin and Saller, 1957.5 The term facial divergence was introduced by the orthodontist‐anthropologist Milo Hellman,10 although the concept had been described by Albrecht Dürer (1528) (Figure 8.7).8 It is essentially a description of the slope or inclination of the face in the sagittal plane (Figure 8.8). It is determined by the sagittal position of soft tissue pogonion (Pog’) and subnasale (Sn) relative to a vertical line dropped from glabella (G’), with the subject’s head in natural head position. The factor that discriminates and distinguishes facial divergence from profile convexity or concavity is the sagittal position of subnasale (Sn) relative to the G’‐Pog’ line. In order for the face to diverge anteriorly or posteriorly, yet not to exhibit signs of convexity or concavity, subnasale (Sn) must be on or nearly on the G’‐Pog’ line; i.e. the upper facial plane (UFP, G′‐Sn) and the lower facial plane (LFP, Sn‐Pog’) are in a straight line, but diverge anteriorly or posteriorly. Figure 8.7 Facial divergence according to Albrecht Dürer. (Modified from Dürer, 15288.) Figure 8.8 Facial divergence. Anthropometric data from North American Caucasian males and females with untreated Class I dental occlusions describing normal facial divergence and ranges of variability has been provided.11 Mean values of facial divergence are negative, with the faces being slightly posteriorly divergent. Anterior divergence does not occur until two standard deviations from the mean. Facial divergence is essentially an ethnic variation in facial profile form. With a straight profile, i.e. no excessive profile convexity or concavity, anterior or posterior facial divergence is compatible with a normal maxillo‐mandibular and dental occlusal relationship. Figure 8.9 Facial profile contour according to Albrecht Dürer. (Modified from Dürer, 15288.) Figure 8.10 Facial profile contours. The contour of the facial profile may be described as convex, straight or concave. This concept was described by Albrecht Dürer (1528) (Figure 8.9).8 With the patient in NHP, the overall contour of the facial profile may be described by the relationship between two lines: the upper facial plane (UFP), connecting glabella (G’) to subnasale (Sn), and the lower facial plane (LFP), connecting subnasale to soft tissue pogonion (Pog’). In a straight profile, these two lines form a nearly straight line. Such a facial profile is termed orthognathic (Greek orthos: correct or straight; gnathos: jaw). An angle between these two lines indicates facial profile convexity (pogonion behind relative to subnasale in the sagittal plane), or facial profile concavity (pogonion ahead relative to subnasale in the sagittal plane). A convex profile indicates a skeletal Class II jaw relationship (and/or sagittal chin deficiency), and a concave profile indicates a skeletal Class III jaw relationship (and/or sagittal chin excess). However, profile convexity or concavity does not of itself indicate whether the maxilla or mandible/chin is at fault (Figure 8.10). Legan and Burstone12 described the angle of facial convexity for the soft tissue profile. It is formed by the two intersecting lines, the UFP (G′‐Sn) and the LFP (Sn‐Pog′). The mean value is estimated to be 12° ± 4°. An increase in the angle in a clockwise direction is positive; anticlockwise is negative. A high positive value suggests facial profile convexity and a Class II skeletal jaw relationship; a smaller positive value, or a negative value, suggests facial profile concavity and a Class III skeletal jaw relationship. However, the value of this angle does not reveal whether the maxilla or mandible/chin is responsible for the sagittal jaw discrepancy. Figure 8.11 Angle of facial profile convexity (facial contour angle). Downs13 described the angle of convexity, formed by the intersection of line nasion to point A (NA) and line point A to pogonion (A‐Pog). Superior extension of the A‐Pog line forms an angle with the NA line; if behind the NA line, the angle is read as positive, indicating a Class II (convex) skeletal profile. A negative angle of convexity indicates a Class III (concave) skeletal profile. Downs provided a range of values from −8.5° to 10°, with a mean of 0°. Again, as with the facial contour angle, the angle of convexity does not determine the localization of the deformity to the maxilla or mandible/chin. An investigation was carried out with the objective of assessing how lower facial profile convexity influences perceived attractiveness. The lower facial profile of an idealized image was altered incrementally between 14° and −16°, creating a range of images which were evaluated by pretreatment orthognathic surgery patients, laypeople and clinicians. A straight profile was perceived as most attractive and greater degrees of convexity or concavity deemed progressively less attractive, but a range of 10° to −12° was deemed acceptable; beyond these values surgical correction was desired. Patients were most critical, and clinicians were more critical than laypeople.14 The facial angle indicates the relative sagittal prominence of soft tissue pogonion. It is formed by the intersection of the true horizontal plane (or Frankfort Horizontal plane) with a facial vertical plane (N′‐Pog’). The angle should be approximately 90°–92°. A greater angle indicates prominence of soft tissue pogonion; an angle less than 90° indicates retrusion of soft tissue pogonion. The soft tissue facial angle does not of itself determine the aetiology of the sagittal position of soft tissue pogonion, which may be due to one or a combination of: Consequently, the facial angle must be used in conjunction with other measurements and analyses. In addition, when constructing the facial vertical line (N’‐Pog’), if the sagittal position of nasion is not acceptable, it may be adjusted to a more ideal position. The alternative is to use soft tissue glabella (G’) rather than nasion. Downs13 described the facial angle as the inferior inside angle in which the facial line (N‐Pog) intersects the Frankfort Horizontal plane. Downs found a mean value of 88° with a range of 82°–95°. It indicates the relative sagittal position of the mandible/chin to the upper face. Figure 8.12 Facial angle. FH, Frankfort Horizontal plane; TrH, true horizontal plane. Figure 8.13 The relationship of the cranial base angle (saddle angle) and anterior cranial base length on the jaw relationship. The relationship of the anterior to the posterior cranial base is of particular importance in the diagnosis of facial profile contour. This relationship depends on the extent of growth at the sphenoethmoidal and spheno‐occipital synchondroses. The cranial base angle (or saddle angle) represents the orientation of the anterior cranial base (SN line) relative to the posterior cranial base (S‐Ba line).15 The average adult values (bearing in mind that there is negligible change in this angle after the age of six years) for the angle N‐S‐Ba are16: As such, the cranial base angle is an important determinant of craniofacial form, as it influences the sagittal position of the face relative to the neurocranium and the sagittal prominence of the mandible relative to the maxilla. A significantly increased cranial base angle contributes to a skeletal Class II jaw relationship, whereas a reduced cranial base angle contributes to a skeletal Class III jaw relationship. If basion is difficult to identify on a lateral cephalometric radiograph, articulare may be used instead, i.e. the posterior cranial base is drawn between sella and articulare. The average adult values for the angle N‐S‐Ar are16: The anterior cranial base length, measured from sella to nasion, may also influence the jaw relationship. For example, increased anterior cranial base length may lead to a Class II jaw relationship, with the maxilla ahead of the mandible in the sagittal plane, whereas reduced cranial base length may lead to a Class III jaw relationship, with the maxilla behind the mandible in the sagittal plane. The average adult values for the anterior cranial base length are16: Figure 8.14 Parasagittal profile contour. An additional and extremely important consideration is the description of the parasagittal profile (Figure 8.14). It is necessary to evaluate the sagittal relationships of the soft tissues from the infraorbital area to the paranasal area to the parasymphyseal area. For example, maxillary hypoplasia may lead to lack of bony support and flattening in the infraorbital region and paranasal hollowing; with a normal parasymphyseal area, this will lead to the appearance of a concave parasagittal profile. The directional pattern of facial growth has a significant effect on facial profile form. Deviations from the normal pattern of jaw growth may be in a predominantly vertical or horizontal direction. Alternative terms are hyperdivergent facial growth pattern (referring to the excessive divergence of the maxillary, occlusal and mandibular planes in relation to each other and to the anterior cranial base).17 Such a pattern of growth leads to a hyperdivergent facial type, alternatively termed a high angle patient (referring to the increased mandibular plane angle), long face deformity or long face syndrome.18 If the hyperdivergent growth is the primary aetiology to an anterior open bite, the terms skeletal open bite or apertognathia (Latin apertus: open; Greek gnathos: jaw) may be used.19,20 The maxilla rotates downward and backward (posterior vertical maxillary excess), as does the mandible during growth. This leads to reduced sagittal projection of the chin. Such a vertical facial growth pattern will tend to be associated with a posterior pattern of mandibular growth rotation. Figure 8.15 Hyperdivergent, ‘high angle’ facial type.
Chapter 8
Facial Type
Introduction
The fictional conception of the ‘normal’
Proportion indices
Head type
Cephalic index
Head type
Cephalic index
Male
Female
Hyper‐dolichocephalic (very long head)
≤70.9
≤71.9
Dolichocephalic (long head)
71.0–75.9
72.0–76.9
Mesocephalic (normocephalic; average head)
76.0–80.9
77.0–81.9
Brachycephalic (short‐wide head)
81.0–85.4
82.0–86.4
Hyper‐brachycephalic (very short‐wide head)
85.5–90.9
86.5–91.9
Ultra‐brachycephalic (extremely short‐wide head)
≥91.0
≥92.0
Ethnic differences
Ethnic differences in white individuals
Head circumference
Ethnic differences (Table 8.3)
Facial type: frontal view (norma frontalis)
Facial shape
Ethnic group
Head width (Eu‐Eu) (mm)
SD (mm)
Head length (G’‐Op) (mm)
SD (mm)
Cephalic index
SD
North American white Caucasian:
Male
Female
153
144
6
5
194
185
8
7
79
78
5
4
African American:
Male
Female
149
141
7
6
199
187
6
6.5
75
75
4
4
Chinese:
Male
Female
158
152
5
5
182
173
6
6
87
88
4
4
Ethnic group
Head circumference (mm)
SD (mm)
North American white Caucasian:
Male
Female
569
544
16
15
African American:
Male
Female
574
547
16
16
Chinese:
Male
Female
560
535
14
15.5
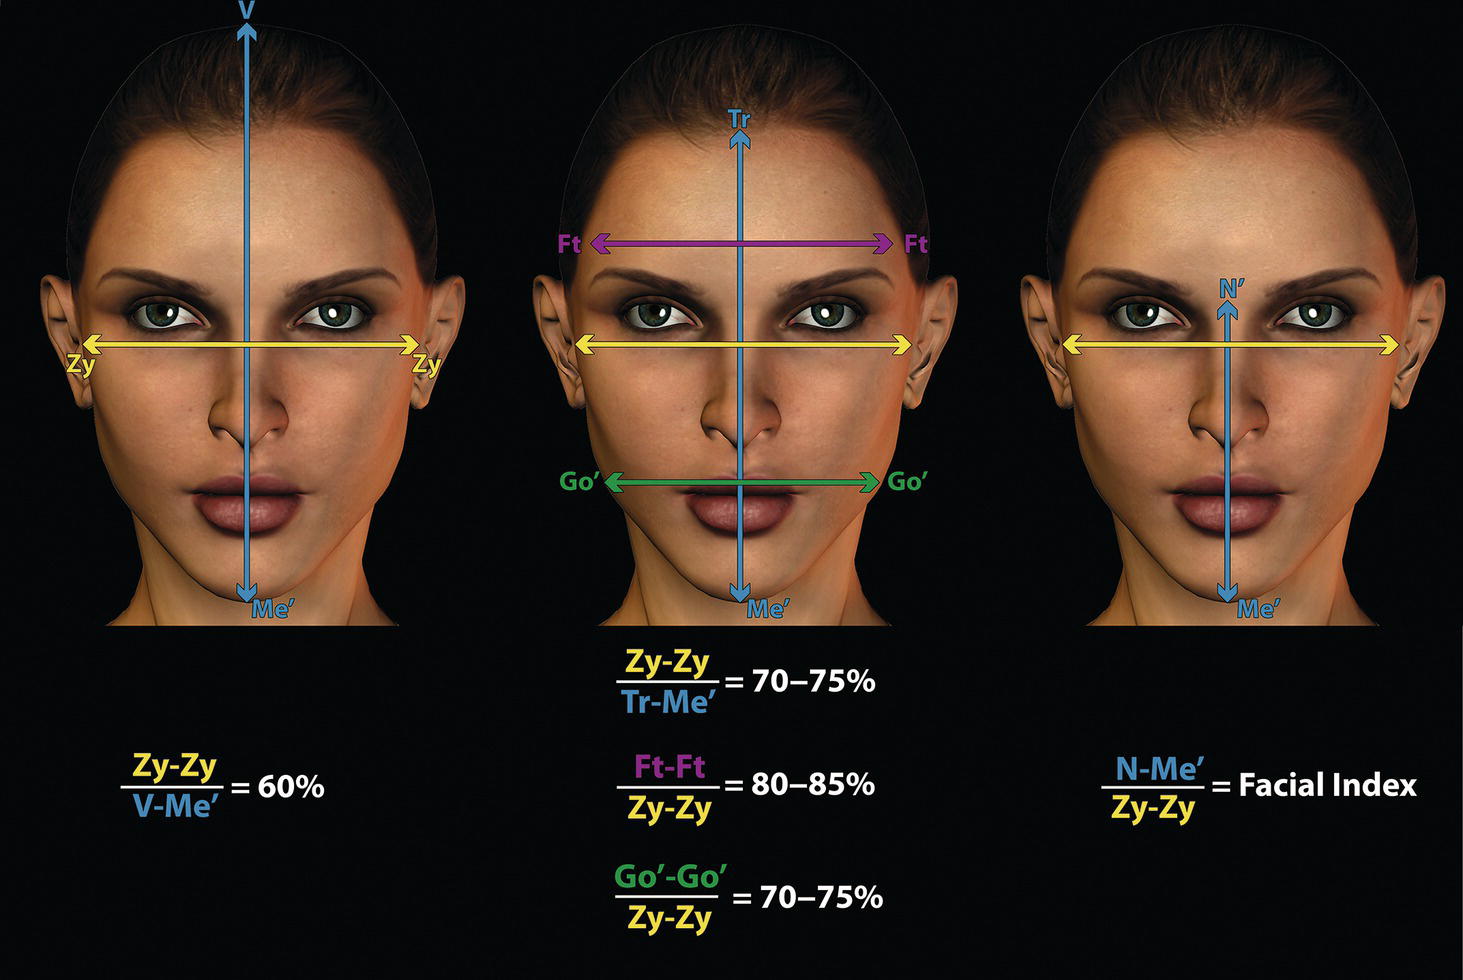
Facial height‐to‐width ratio/proportion (Figure 8.4)
Facial index
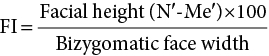
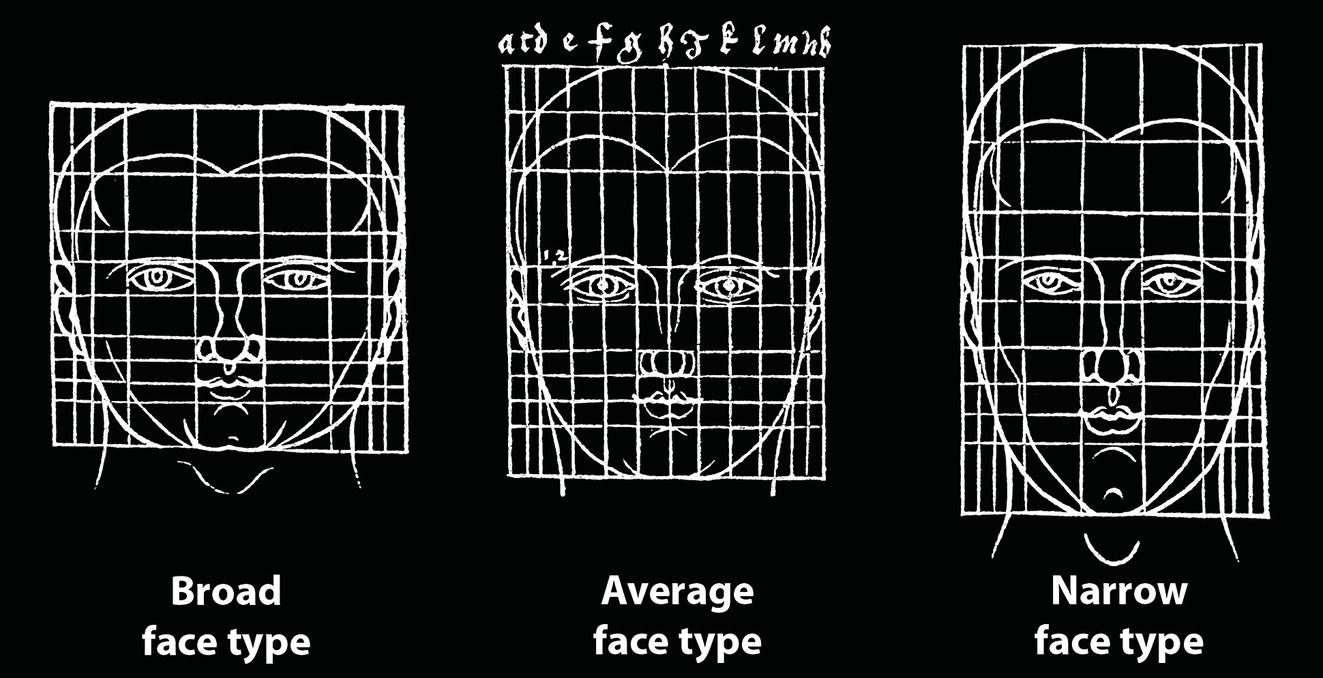
Face type
Facial index
Males
Females
Hyper‐euryprosopic (very broad, short face)
≤78.9
≤76.9
Euryprosopic (broad, short face)
79.0–83.9
77.0–80.9
Mesoprosopic (normoprosopic; average face)
84.0–87.9
81.0–84.9
Leptoprosopic (tall, narrow face)
88.0–92.9
85.0–89.9
Hyper‐leptoprosopic (very tall, narrow face)
≥93.0
≥90.0
Facial type: profile view (norma lateralis)
Facial divergence
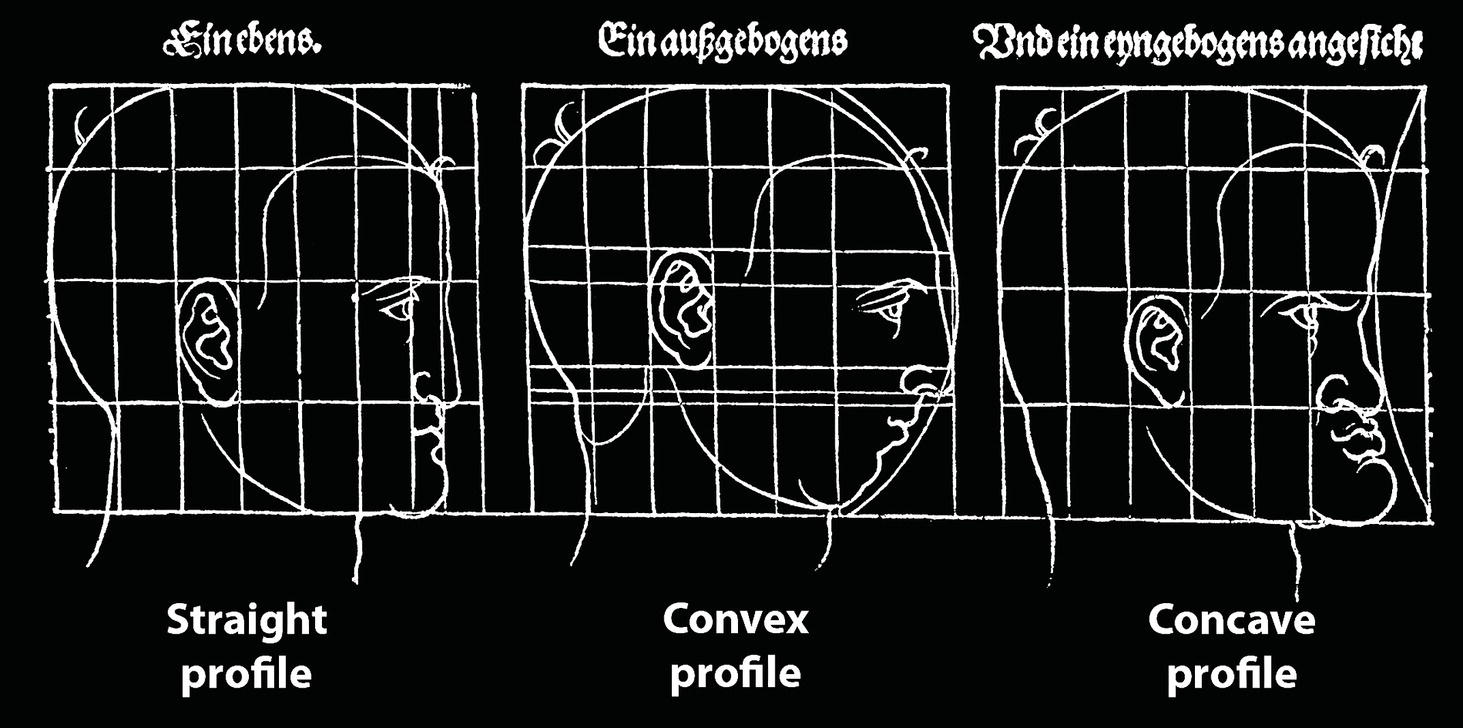
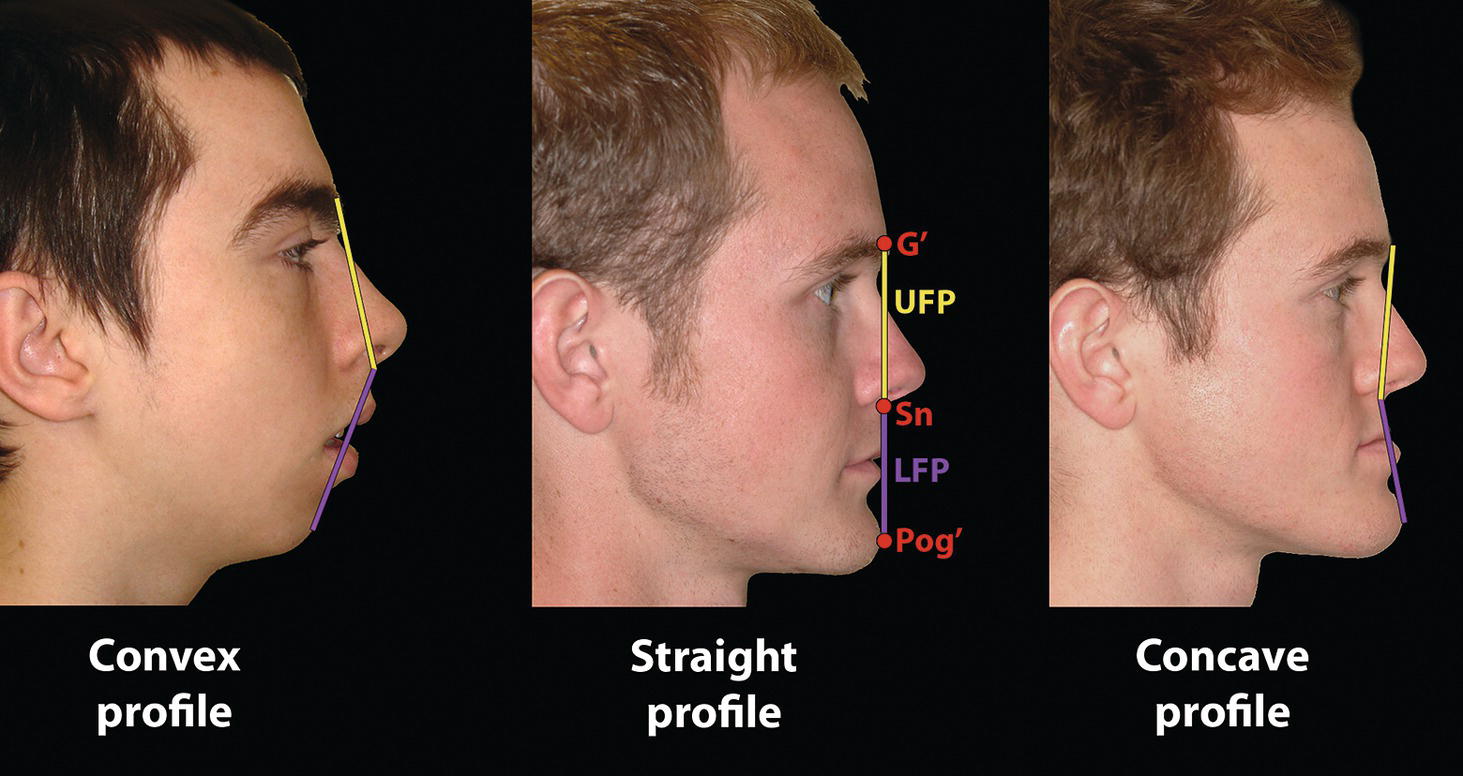
Sagittal facial profile contour
Angle of facial profile convexity (alternative term: facial contour angle) (clinical/soft tissue) (Figure 8.11)
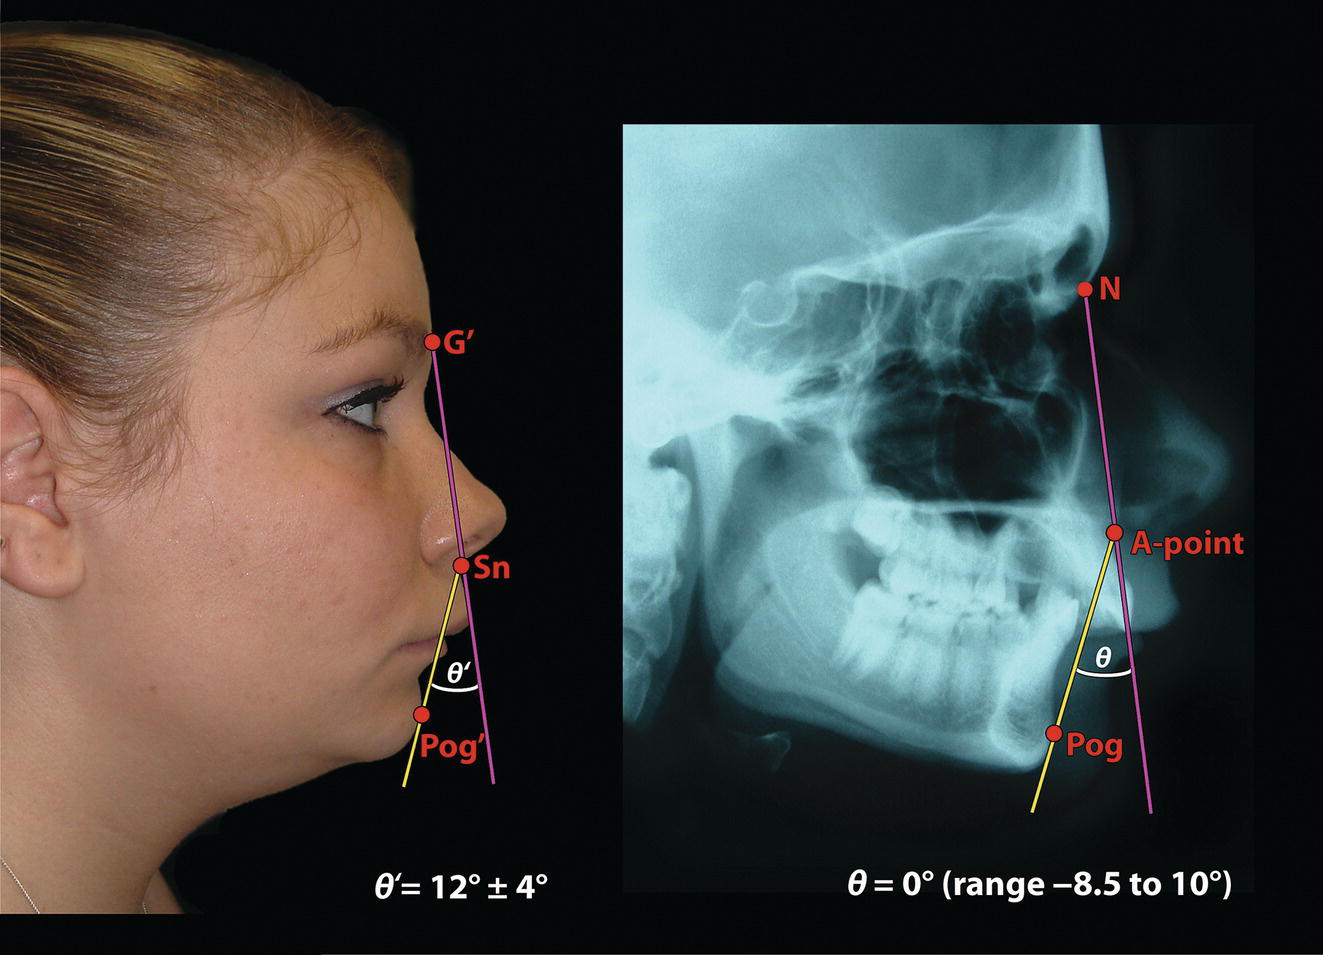
Angle of facial profile convexity (cephalometric/skeletal) (Figure 8.11)
Attractiveness research
Facial angle (clinical/soft tissue) (Figure 8.12)
Facial angle (cephalometric/skeletal) (Figure 8.12)
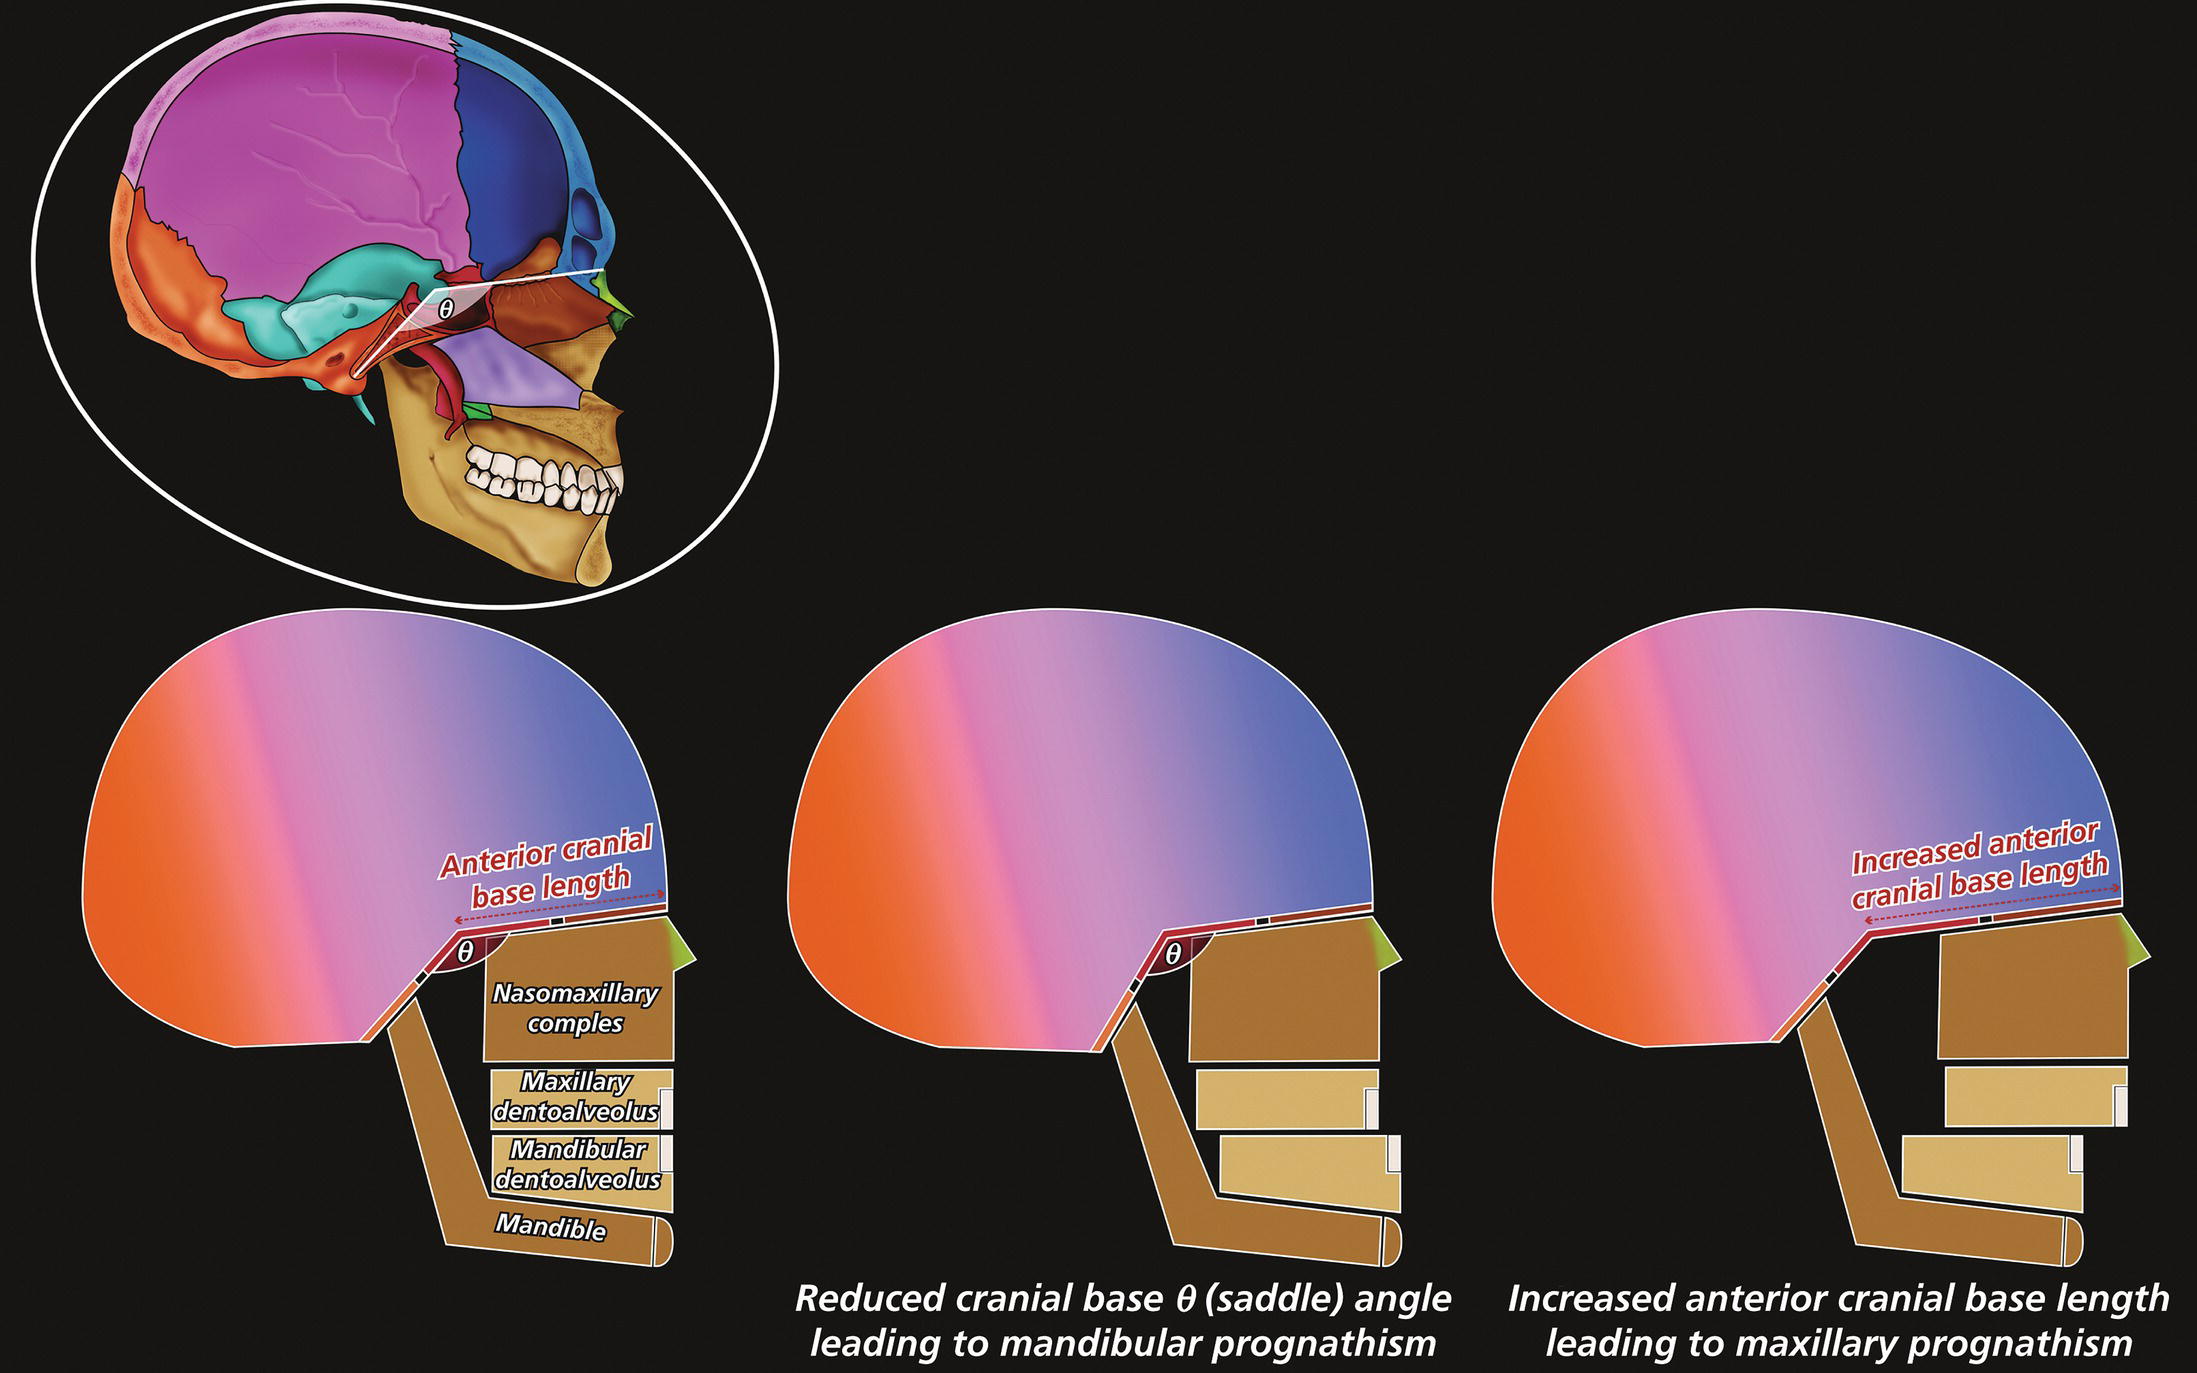
Cranial base angle (Figure 8.13)
Anterior cranial base length (Figure 8.13)
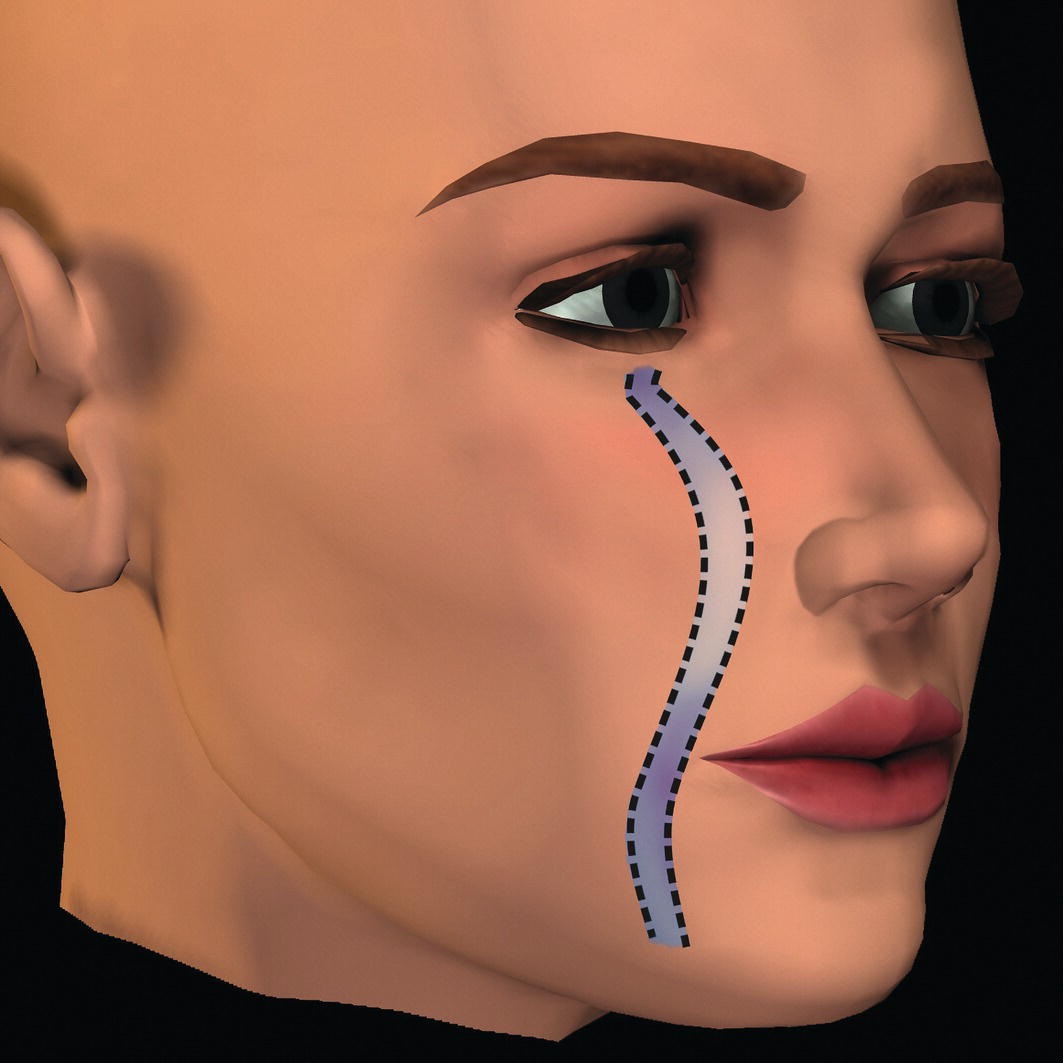
Parasagittal facial profile contour
Vertical facial profile form
Vertical facial growth pattern and hyperdivergent facial type (Figure 8.15)
Related posts:


Stay updated, free articles. Join our Telegram channel

Full access? Get Clinical Tree


