Chapter 3 Epidemiological, demographic, and outcome characteristics of burn injury*
 Access the complete reference list online at http://www.expertconsult.com
Introduction
In the United States in 2009 there was a fire/burn death every 3 hours and a burn injury occurred every half hour.1 In 2007, the most recent year for which numbers and rates of injury deaths are available, there were an estimated 182 479 deaths from all injuries in the United States, which in a total population of 301 579 895 at that time represented a crude injury death rate of 60.51/100 000 population. Data supplied by the CDC in the WISQARS** Injury Mortality Report indicate that in 2007 there were 3774 (1.25/100 000 population) fatal fire/burn injuries, which represented 2.1% of all fatal injuries. There were more fatal fire/burn injuries in men (2230) than in women (1544), but those in women represented a greater percentage of all fatal injuries than in men, 2.7 % vs 1.8%, respectively. Unintentional fire/burn deaths in 2007 represented only 2.7% of all unintentional injury deaths but were 11.3 times more common than violence-related fire/burn deaths (Table 3.1).2
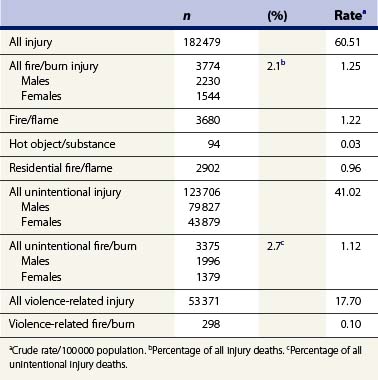
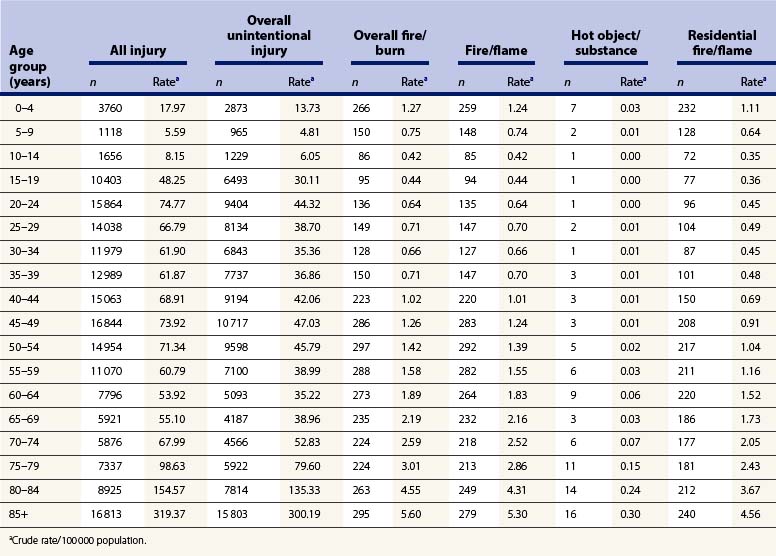
As indicated in Table 3.2, in 2007 there were an estimated 266 fire/burn deaths in the 0–4-year age group, 259 as a consequence of fire and flame and only seven due to contact with a hot object or substance.2 The number of fire/burn deaths decreased to a low of 86 in the 10–14-year age group, rose in the older age groups, and was above 200 in all age groups of 40 years and over. In all age groups fire/flame was the predominant cause of fatal injury, and contact with a hot object or substance caused only 16 or fewer deaths during that year. The majority of deaths in all age groups were the consequence of residential fire/flame injury. The table illustrates the age-related changes in the relationship of burn injury and site of burn injury to overall injury fatalities in 2007. The WISQARS Fatal Injury mapping program documents that fire/burn death rates in the United Sates vary considerably between states. During the years 2000–2006, fire/burn death rates per 100 000 population ranged from a high of 3.39 and 2.70 in Mississippi and Arkansas, respectively, to a low of 0.54 and 0.53 in Colorado and Utah, respectively. Age less than 4 years, age 65 years and over, rural residency, and economic deprivation have all been reported to define groups that are at increased risk of fire-related injury and death. Differences in these risk factors may account in part for the differences in burn incidence rates and mortality between states.2
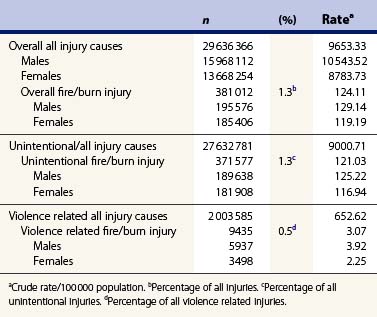
In 2009, the most recent year for which numbers and rates of non-fatal injuries are available, there were an estimated 29 636 366 persons with non-fatal injuries in the United States, which in a total population of 307 006 550 at that time represented a crude non-fatal injury rate of 9653.33/100 000. Data supplied by the NEISS WISQARS program indicate that in 2009 there were 381 012 non-fatal fire/burn injuries (124.11/100 000), which represented 1.3% of all non-fatal injuries that year. Non-fatal fire/burn injury as a percentage of all non-fatal injuries in 2009 showed little gender difference, i.e. 1.2% for men and 1.4% for women. Unintentional fire/burn injuries in 2009 represented only 1.3% of all unintentional non-fatal injuries but were almost 40 times (39.4) more common than violence-related non-fatal burns (Table 3.3).3
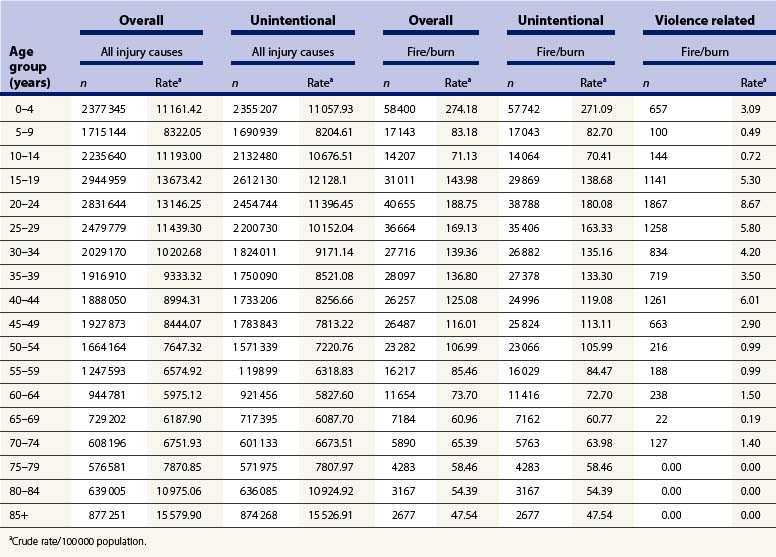
Overall unintentional non-fatal fire/burn injuries represent a variable percentage of all injuries and all unintentional injuries as related to the population in various age groups (Table 3.4). Overall fire/burn injuries represented 2.5% of all non-fatal injuries, and unintentional fire/burn injuries represented 2.5% of all non-fatal unintentional injuries in the 0–4-year age group, and 1% of both overall and unintentional injuries in the 5–9-year age group. The total number and rates of both all-cause and unintentional non-fatal fire/burn injury in 2009 were greatest in the 0–4-year age group, i.e. 58 400 (274.18/100 000) and 57 742 (271.09/100 000). In the 5–19-year age groups both the number and rate of both overall and unintentional non-fatal burn injuries decreased, only to rise again in the 20–24-year group, i.e. 40 655 (188.75/100 000) for overall burn injury and 38 788 (180.08/100 000) for all unintentional burn injuries. In age groups above 24 years the number and rate of occurrence of burns decreased with age, and after age 80 were all reported to be unintentional injuries. There were only 2677 unintentional burn injuries recorded for patients of 85 years and above, with an incidence rate of 47.54/100 000.3
In 2009, the rank of unintentional fire/burn injury as a cause of non-fatal injury, 14th for all ages, varied by age in the United States.3 As indicated in Table 3.5, burn injury ranged from being the fifth most common cause of non-fatal injury in the population under 1 year of age to being the 16th in the 10–14- and 15–19-year age groups. The number and incidence rates for non-fatal burn injury have decreased overall, and for both males and females over the last three decades, as shown in Table 3.6. Since 1985, the incidence rate of non-fatal fire/burn injuries for males decreased from 601/100 000 to 129.14/100 000 in 2009. The incidence rate for females decreased even more during the same period, i.e. from 647/100 000 in 1985 to 119.19/100 000 in 2009. A report by the National Center for Injury Prevention and Control in 2001 indicated that 95.7% of patients with unintentional fire/burn injuries seen in emergency departments were ‘treated and released’, and only 3.4% of all patients with fire/burn injuries seen in emergency departments were hospitalized and or transferred to another treatment facility.4 Those data confirm the facts that the vast majority of non-fatal burns are of very limited extent, and that in the United States patients with extensive burns are often transferred to burn centers.
Table 3.5 Number and rank of unintentional fire/burn as cause of non-fatal injury by age group: US 20093
| Age group (years) | n | Rank |
|---|---|---|
| >1 | 7846 | 5 |
| 1–4 | 48 896 | 8 |
| 5–9 | 17 043 | 12 |
| 10–14 | 14 064 | 16 |
| 15–19 | 29 869 | 16 |
| 20–24 | 38 788 | 13 |
| 25–34 | 62 288 | 13 |
| 35–44 | 52 374 | 13 |
| 45–54 | 48 890 | 14 |
| 55–64 | 27 445 | 13 |
| 65+ | 23 051 | 12 |
| All ages+ | 371 577 | 14 |
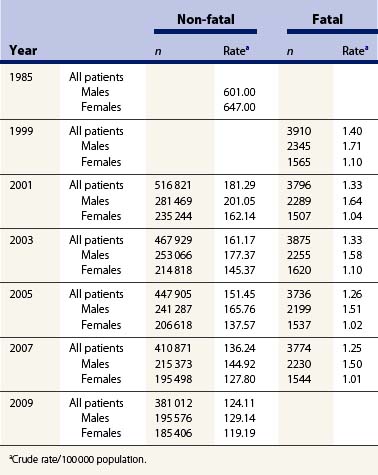
The number and incidence rate of fatal burn injuries has decreased only modestly in recent years, i.e. from a total of 3910 (1.40/100 000) in 1999 to 3774 (1.25/100 000) in 2007. That decrease has largely been confined to the male population, in whom fatal burns decreased from 2345 (1.71/100 000) in 1999 to 2230 (1.5/100 000) in 2007, with essentially no change occurring in the female population, i.e. 1565 in 1999 and 1544 in 2007, both of which represented crude incidence rates of 1.01/100 000 (Table 3.6).2
The American Burn Association has established the National Burn Repository (NBR), which contains records of patients treated for burn injuries at 91 hospitals in 35 states and the District of Columbia. For the years 2001–2010, those hospitals contributed records from 163 771 burn patients. Analysis of that database provides a more detailed description of patients treated at burn centers in the United States.5 In the years reviewed, 2001–2010, 70% of the cases were males. The mean age of all patients was 32 years, with 12% being 60 or over and 18% being under 5 years of age; 68% of the burn injuries occurred in the home and only 10% were sustained in the workplace. Sixty-seven percent of cases (89 124) were classified as non-work-related, 16% (20 846) as work-related, 1.4% (1898) as suspected assault/abuse, 1.1% (1458) as suspected self-inflicted, 1.1% (1487) as suspected child abuse, and 0.2% (234) as suspected arson.
The NBR data indicate that 93 049 (60%) of the patients were Caucasian, 29 584 (19%) African-American, 23 230 (15%) Hispanic, 3737 (2%) Asian and 1191 (1%) Native Americans. The 18.9% registrant rate of African-Americans exceeds by 53% the 12.33% African-American segment of the US population. Non-white patients predominated in the three age groups below 5 years, and in all other age groups whites predominated. The Caucasian registrant rate of 60% was slightly less than the 66% Caucasian segment of the US population, the Hispanic registrant rate of 15% was similar to the 15% Hispanic segment of the US population, and the Asian registrant rate of 2.4% was 45% less than the 4.37% Asian segment of the US population.5
Scalds and fire/flame were the most common causes of burn injury. There were a total of 44 537 scald injuries, of which 32 535 (82%) occurred in the home. Scald injury was most frequent in cases under age 5, and in the older age groups fire/flame, a total of 60 139 cases, predominated as the cause of burn injury. There were 5400 cases of electric injury, of which 1896 (43%) occurred at an industrial site and 1181 (27%) occurred in the home. Electric injury occurred with greatest frequency – more than 1000 cases – in each age group between 20 and 49.9 years. There were a total of 12 005 contact burns, 72% of which occurred in the home. Contact burns were most common in patients under 5 years (25.2% of cases less than 1 year old) and represented less than 10% of burns in all older age groups. There were 4372 chemical injuries, of which 1543 (35%) occurred at the workplace and 1354 (31%) in the home.5
Seventy-two percent of the cases had burns of less than 10% of the total body surface area (TBSA) and 90% had burns that involved less than 20% TBSA. The upper limbs, the head and neck, and the lower limbs were the body parts most often affected by burns. The most frequent complications, in order of decreasing frequency, were pneumonia, cellulitis, urinary tract infection, respiratory failure, and wound infection. A diagnosis of inhalation injury was made in 10 216 (6.3%) of all the cases. The use of mechanical ventilation, common in patients with inhalation injury, markedly increased the occurrence of clinically related complications. Those complications increased in both frequency and number as the duration of mechanical ventilation increased. In patients ventilated for more than 4 days, complications occurred in more than 40% of patients of all ages and rose to over 60% in patients older than 20 years.5
The most common surgical procedures performed were split-thickness skin grafting, burn wound excision, application of wound dressings (either biologic or non-biologic), and joint and hand procedures. Early excision with prompt grafting to close the wound, and the predominance of cases with limited-extent burns have been largely responsible for the observed reduction in length of hospital stay. During the reporting period, the average length of hospital stay decreased from 10.37 and 10.1 days in 2001 to 8.6 and 9.1 days in 2010 for women and men, respectively. The number of hospital days averaged 9.6 for patients who survived and 17.7 days for patients who died.5
The overall mortality of the 124 196 cases for which burn extent was recorded was 3.7 %. The mortality rate ranged from 0.6% in cases with burns of less than 10% TBSA and 2.8 % in cases with burns of 10–19.9% TBSA to 74% in cases with burn of 80–89% TBSA and 82.8% in cases with burns of 90% and more TBSA. Mortality decreased progressively during the review period by almost 50% (6.8% to 3.6%) for females, and from 4.6% to 3.2% for males. The 23% mortality observed in the 10 216 cases with inhalation injury was nine times greater than the 2.5% mortality recorded for the 132 020 burn patients without inhalation injury. There were 163 771 surviving cases, of which 137 610 or 84% were discharged home, with only 4% requiring home healthcare. Almost 5000 (3%) were discharged to a rehabilitation facility, 2.3% (almost 4000) were discharged to another hospital, and 1.9%, slightly more than 3000, were discharged to a nursing home.5
Hospital charges were significantly less ($4,815 per day) for those cases that survived (mean total charge $69,053) than for those who died (mean total charge $212,593). Sixty-nine percent of cases were covered by some form of payment and 30% were either uninsured or provided no insurance information. The total annual costs of burn injury are estimated to be $7.5 billion, which includes both medical costs and the cost of lost productivity. Those costs include $3 billion related to fatal fire/burn injuries, $1 billion for fire/burn injuries treated in hospitals, and $3 billion for injuries not utilizing inpatient care. Fires also cause extensive property damage. In 2009 there were 1 348 500 reported fires, to which $12.5 billion in property damage was attributed.6
Epidemiology and demography
Geographic location influences death rates from house fires, presumably because of regional differences in construction and heating devices, as well as economic status. House fire death rates have been reported to be higher in the Eastern part of the United States, particularly the Southeast compared to the West. In the 377 000 residential fires to which fire departments responded in 2009, 2565 individuals died and 13 050 sustained burn injuries.1 The winter months, lack of smoke alarms, and substandard housing represent risk factors for residential fires.7 Unattended and/or improperly positioned cooking and heating devices are the leading causes of residential fires. House fires cause only approximately 4% of burn admissions, but the 12% fatality rate of patients hospitalized for burns sustained in house fires is higher than the 3% rate for patients with burns from other causes.8 This difference is presumably the effect of associated inhalation injury.
Careless smoking, which accounts for one in four residential fire deaths, is the most common cause of such fatalities.9 Alcohol and drug intoxication, which contribute to careless smoking behavior by impairing mentation, have been reported to be a factor in 40% of residential fire deaths and appear to contribute to the high weekend frequency of house fires.10 Holmes and colleagues11 reported a statistically significant increase in patients with alcohol-related burn injuries admitted to a UK Regional Burn Unit, rising from 6% of admissions in 2003 to 19% of admissions in 2008. In 60% of cases the injuries were caused by flames and required a longer hospital stay than did the injuries in patients with burns unrelated to alcohol: 7.9 days vs 2.5 days. ‘Fire play’ with matches, cigarette lighters, and other ignition devices has been incriminated as the cause of one in 20 residential fires and two in every five fire-related deaths in children.12 House fire death rates have shown little gender predominance except for a larger number of males in the 2–5-year age group, a group that has the highest rate of non-fatal burns due to unsupervised play with matches.13 In fact, among children of 9 years or less, child-play fires are the leading cause of residential fire-related death and injury.
Arson, the second most common cause of residential fire deaths (an estimated 30 000 cases in 2008), is considered to be an intentional injury.14 Defective or inappropriately used heating devices, which are the third most common cause, account for one in six residential fire deaths overall, and an even greater proportion in low income areas.15 The effect of low income on fire/burn deaths is also related to residence in older buildings or manufactured homes, crowded living conditions, and the absence of smoke detectors.1 In 2007, 432 children aged 14 or under died as a consequence of residential fires.1 In 1993, minority children aged 0–19 were reported to be three times as likely to die in a residential fire as white children; this was considered to be an effect of economic status, as racial differences in house fire death rates decrease as income increases.16,17
The linking of databases from five states has enabled investigators to characterize burn injury in the state of Utah.18 During the years 1997 to 2001, 23 722 residents of Utah sustained burns that received care at some level in the healthcare system. The causes were scalds (21.5%), contact with a hot object (21.2%), chemical (19.2%), fire or flame (18.7%), ‘other’ (11.7%), and electricity (3.9%). Thirty-one individuals (0.1%) sustained fatal burns. The annual incidence rate of burn injury in Utah was 212.5/100 000 residents. The burn injury incidence rate was higher among men than among women, and highest in the 0–4, 15–19, and 20–44 age groups and lowest in the 65–84 and 85+ age groups. The use of geographic information systems mapping enabled the investigators to identify the Utah counties at high risk for burn injury. Those counties typically had higher American-Indian populations, increased poverty levels, and other indices of economic deprivation.
In a study of the socioeconomic determinants of burn injury in British Columbia, Canada, Bell and colleagues19 reviewed the records of 119 patients with what was categorized as ‘severe thermal injury.’ The age-standardized injury rate for all burns in that province was 3.1/100 000, but the injury rate varied from 2.95/100 000 for all patients in the highest socioeconomic stratum to 5.4/100 000 among all individuals in the lowest socioeconomic stratum. The age-standardized burn injury rate was greater for individuals in rural areas than for those in urban areas in all socioeconomic strata. The finding that the age-standardized injury rate for intentional burn injury was highest in the highest urban socioeconomic stratum was not explained by the authors.
It has been reported that mobile home fires are associated with twice the death rate of fires in other forms of housing. In a group of 65 patients who were burned in mobile home fires and admitted to a burn center, more than three-quarters were male, two-thirds were Caucasian, and 70% resided in the southeastern United States.20 The extent of burn ranged from 1% to 63% TBSA and averaged 21%. Inhalation injury was diagnosed in 63% of the patients. One or more comorbid medical conditions pre-existed in 88% of patients, which included alcoholism in 64%. Of interest, one-quarter of the patients had a family history of burn injury. The mortality rate of 12% was higher than the overall mortality rate at the burn center, but contrary to earlier reports that mortality rate was similar to that of patients burned in other residential fires.
During the 5-year period 1991–1995, the residential fire death rate decreased from 1.3 to 1.1/100 000 and by 2007 had further decreased to 0.94/100 000.2,21 That change has been attributed to the combined effects of improved building design, the use of safer appliances and heating devices, and the increased use of smoke and fire detectors. Data generated by the CDC’s Smoke Alarm Installation and Fire Safety Education Program indicate that even though there are half or fewer fire related deaths in homes with functioning smoke alarms as in homes without those devices, only approximately 75% of US households claim to have at least one working smoke alarm. Even so, there was no alarm or no working alarm in two-thirds of home-fire deaths in 2003–2006. The CDC Injury Center provides funds to 16 states to conduct a smoke alarm installation and fire safety education (SAIFE) program. This includes the installation of long-lasting lithium-powered smoke alarms, which have been installed in more than 174 000 high-risk homes and are estimated to have saved approximately 1218 lives since the program began in 1998.14,22,23 Having a wet pipe sprinkler system in the home affords even greater protection by reducing the risk of dying in a fire by 83%.24
Unlike fire deaths, the precise number of burn injuries that occur in the United States is unknown. Twenty-one states require that burn injuries be reported, but two require that only burns associated with assaults or arson be reported, and seven require that only larger burns (usually those involving more than 15% TBSA) be reported.25 Consequently, the total number of burns has to be estimated by extrapolating data collected in less than half of the states to the entire population. In the late 20th century, such estimates ranged from 1.4 million to 2 million injuries due to burns and fires each year.26,27 Because of the general improvement in living conditions made possible by the relatively high income in the United States, an annual incidence of approximately 500 000 is currently considered to be a realistic estimate, of which 450 000 receive medical care at some level of the healthcare system.28 The majority of those burns are of limited extent: 72% involve less than 10% TBSA and 90% involve less than 20% TBSA. However, as recently as 1990, it was estimated that in the United States 270–300 patients per million population (67 500–75 000) per year sustained burns which, because of extent, associated injury or comorbid conditions, required admission to a hospital.29 In light of the overall decrease in the incidence of burns, it is currently estimated that only 145–150 patients per million population (45 000–50 000) will be admitted to a hospital annually.
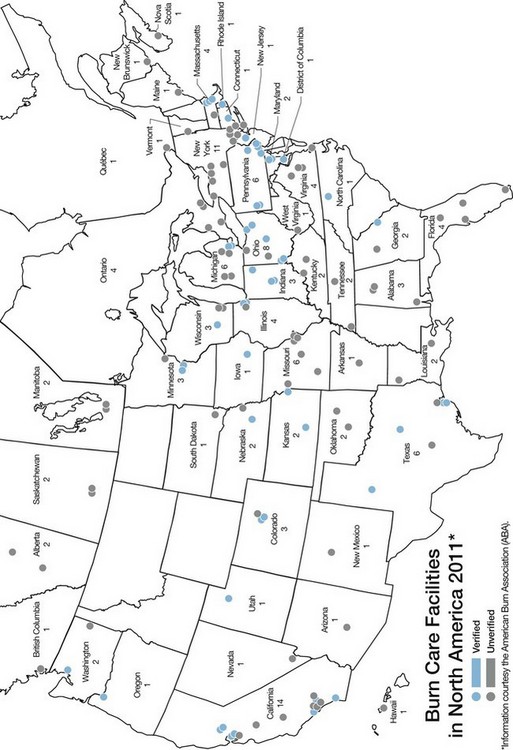
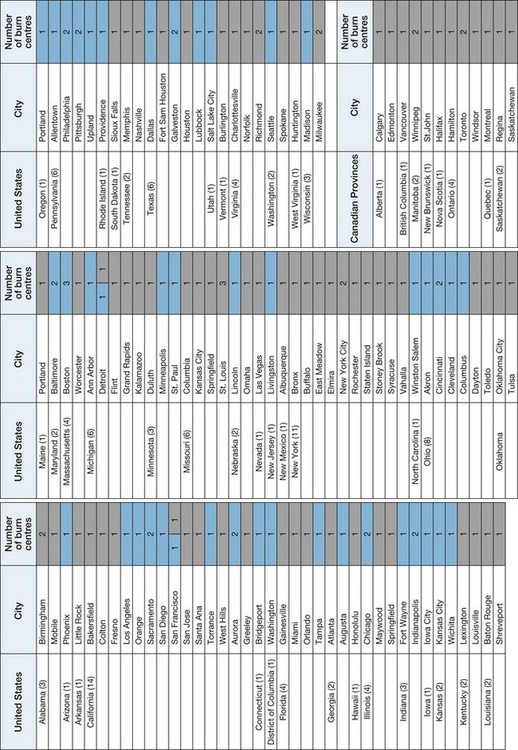
A smaller subset of approximately 20 000–25 000 burn patients with even more severe injuries, as defined by the American Burn Association (Table 3.7), are best cared for in a burn center.30 Those patients are now estimated to consist of 35 per million population with major burns and 40 per million population having lesser burns but a complicating cofactor. There are 123 self-designated burn care facilities in the United States, 54 of which have been verified by the American Burn Association as burn centers, and 14 in Canada, which are distributed in close relationship to population density; between them they are reported to contain a total of 1788 and 125 beds, respectively (Figure 3.1).5 As described below, the geographic distribution of burn centers necessitates the use of aeromedical transfer by both rotary and fixed wing aircraft to transport patients requiring burn center care to those facilities from distant and remote areas.
Table 3.7 Burn center referral criteria
Adapted from: American Burn Association. Advanced Burn Life Support Course Provider Manual American Burn Association, Chicago, IL 60611; 2011, p. 25–26
High-risk populations
In addition to economic status and geographic location, the risk of being burned and the predominant cause of burn injury are related to age, occupation, and participation in recreational activities. Scalds are the most frequent form of burn injury overall and cause over 100 000 patients to seek treatment in hospital emergency rooms, but fire/flame is the most frequent cause of burns requiring hospital admission.7
Children
The number of pediatric burn patients admitted to hospitals is influenced by cultural differences, resource availability, and medical practice. Consequently, the number of children admitted to hospital for burns treatment has varied by geographic area from a low rate of 4.4/100 000 population in America (North, Central, and South) to a high of 10.8/100 000 population in Africa. Although the incidence rate for Asia – 8.0/100 000 population – is similar to that for Europe and the Middle East, population size determines that Asia provides care for over half of the global pediatric burn population.31 It is currently estimated that 435 children aged 0–19 receive treatment in emergency departments for burn injuries, and that two children die with burn injuries each day in the United States.32
It was estimated in 2004 that 116 600 children aged 14 and under were treated for fire/burn injuries in hospital emergency rooms in the United States.33 Of those injuries, scald burns were more common in the younger children (<5 years) and flame burns more common in older children. Children under 5 years account for nearly all scald burn deaths.34 Of the children age 4 and under who are hospitalized for burn-related injuries, 65% have scald burns, 20% contact burns, and the remainder flame burns.33 The majority of scald burns in children, especially those age 6 months to 2 years, are from hot foods and liquids, particularly coffee which may be dispensed at temperatures of up to 180°F (82.2°C), spilled in the kitchen or other places where food is prepared and served.34 Hot tap-water burns, which typically occur in the bathroom, tend to be more severe and cover a larger portion of the body surface than other scald burns. Consequently, such burns, which account for nearly one-quarter of all childhood scald burns, are associated with higher hospitalization and death rates than other hot liquid burns.34 Ninety-five percent of burns in children due to the operation of microwave devices are scald burns resulting from the spillage of hot liquids or food.34
In a study of 541 children with burn injury, 125 were considered to be cooking injuries. The patients with such burns were, on the average, older than those with scalds related to other mechanisms (i.e. toddlers vs infants).35 The burns were typically caused by hot liquids spilling from a container on an elevated table or counter on to the child’s head, neck, and trunk. The authors call attention to the difference in cooling curves for the various substances and liquids involved, which they postulate influences the severity of the burn injury.
A recent review of the American Burn Association National Burn Registry records of all pediatric patients burned between 1995 and 2007 (46 582) revealed differences in burn etiology associated with age and race.36 Fifty-four percent of the patients studied were Caucasian, but non-Caucasian populations incurred 54% of the burn injuries that occurred in children younger than 5 years. Scalding was a common etiology in older African-American, Asian, and Hispanic children, and significantly less common in Caucasians. The frequency of inhalation injury was highest in African-American children and lowest in Asian children. In 4.5% of the children the injury was reported to have been intentional, with the frequency in populations of color greater (greatest in African-American children) than in Caucasian children.
Among children 14 years and under, hair curlers and curling irons, room heaters, ovens and ranges, irons, gasoline, and fireworks are the most common causes of product-related burn injuries.34 Nearly two-thirds of electric injuries in children aged 12 and under are caused by household electric cords and extension cords.34 Contact with the current in wall outlets causes an additional 14% of such injuries.34 Boys are at higher risk of burn-related death and injury than girls, and children aged 4 and under and children with a disability are at the greatest risk of burn-related death and injury, especially from scald and contact burns.34 Heavy-for-age boys are more burn prone than their normal-sized counterparts. A retrospective study of 372 children admitted to a single burn center from January 1991 to July 1997 confirmed that boys who were large for age on the basis of weight or height were over-represented in the burn population.37 Interestingly, that same study indicated that boys at or under the fifth percentile for weight, and both boys and girls at or under the fifth percentile for height were also over-represented among pediatric burn patients. The authors considered the latter finding to reflect, at least in part, the effect of concomitant malnutrition or neglect.
The occurrence of tap-water scalds can be prevented by adjusting the temperature settings on water heaters or by installing special faucet valves so that water does not leave the tap at temperatures above 120°F (48.8°C).34 Thermostatic valves, which shut the hot water off if the cold water fails, are the most dependable.38 The results of a survey in Denmark indicated that the kitchen, not the bathroom, is the most common site of burn injury (39% of burns).39 Those burns were most commonly due to contact with hot liquids.
Home exercise treadmills represent another source of burn injury in children. These injuries are a consequence of contact with a moving treadmill, most commonly involved the volar surface of the hand, and in two-thirds of patients surgical intervention in the form of skin grafting was required.40
A change in the pattern of pediatric burns in Australia to resemble that in the United States has recently been reported. A review of 3621 children treated at the Children’s Hospital Burns Unit at Westmead, NSW, Australia, indicated that scalds accounted for 56% of pediatric burns and that contact burns, which accounted for 31% of pediatric burns, had displaced flame burns, which accounted for only 8%, as the second most frequent cause of pediatric burns.41 As expected, contact burns were typically of very limited extent (99% < 5% TBSA) and only 12% required operative intervention. The most common objects causing contact burns were, in descending order, clothing irons, stoves, oven doors, gas or electric heaters, exhaust pipes, combustion heaters, and barbecues. The same authors from the Children’s Hospital Burns Unit reviewed the management of 97 children admitted for the treatment of burn injuries caused by contact with automotive exhaust systems during a 6-year period.42 The patients’ ages ranged from 5 months to 15 years and the exhaust systems contacted were those of motorbikes, cars, lawnmowers, and quad bikes. The injuries were most often sustained during the summer, and in 60% of cases involved 1% or less of TBSA, ranging in extent from 0.5% to 8%. Over 66% of the burns were on the lower limbs, with the calf being the part most frequently involved. Excision and/or grafting was necessary in one-third of the patients. The authors’ emphasized prevention by the use of protective clothing and placement of an insulated guard on the exhaust pipe.
The elderly
The elderly represent an increasing segment of the population, the members of which have an increased risk of being burned and higher morbidity and mortality rates than younger patients. A review of medical records of patients admitted to a burn center during a 7-year period revealed that 221 of 1557 (11%) patients admitted were 59 years or older.43 Ninety-seven (44%) of that group were women, a reflection of the higher percentage of women in the elderly population. Two-thirds of the injuries were caused by flames or explosions, 20% by scalds, 6% by electricity, 2% by chemicals, and 6% by ‘other causes.’ Forty-one percent of the injuries occurred in the bedroom and/or living room, 28% out of doors or in the workplace, 18% in the kitchen, 8% in the bathroom, and 5% in the garage or basement. Seventy-seven percent of the patients had one or more pre-existing medical conditions, and 64 patients (29%) had smoke inhalation. In 57% of patients judgment and/or mobility were impaired. Ten percent of patients tested positive for ethanol and 29% for other drugs by toxicology screening. Survival advantage was conferred by younger age, absence of inhalation injury, absence of pre-existing medical conditions, and smaller burns.
Among 111 octogenarians admitted to a burn center between 1983 and 1993, scalds caused 32% of the burns, flames 30%, contact 29%, bath immersion 7%, electricity 2%, and hot oil 1%.44 In 18% a disease such as a stroke was considered to be directly responsible for the burn injury, and in an additional 50% of the patients a pre-existing disease was considered to be contributory. The average length of hospital stay was almost twice that of younger adults, and rehabilitation of survivors was markedly prolonged.
Scalds are responsible for 33–58% of all patients hospitalized in the United States for burns each year.45 Data from the NEISS-All Injury Program for 2001 to 2006 revealed that 51 700 adults aged 65 or over received care in emergency departments for non-fatal scald burns during that period, representing an annual frequency of 8620 and an estimated annual rate of 23.8 visits per 100 000 population. Three-quarters of the non-fatal scald injuries occurred at home, 42% were due to contact with hot food, and 30% were caused by hot water or steam. Two-thirds of the patients were women. The burns, which involved predominantly the upper and lower limbs, were relatively minor, with 7970 (93%) being treated and released and only 510 (6%) requiring inpatient care.
A recent review of 23 180 records in the American Burn Association National Burn Repository has characterized the epidemiology and outcomes of older adults with burn injury.46 The mean extent of burn (9.6% TBSA) and the frequency of inhalation injury (11.3%) did not significantly vary among the age groups evaluated, i.e. 55–64 years, 65–74 years, and 75 years and over. Overall, there was a male preponderance of 1.4:1, but women dominated in the oldest age group. The length of hospital stay per percent of body surface burned increased with age, as did hospital charges, even though the number of operations per patient decreased. As the group age increased, mortality also increased, as did discharge to a non-independent status. The adjusted odds ratios for mortality as calculated by logistic regression were 2.3 and 5.4 in the 65–74-year age group and the 75-years and above group, respectively, using the 55–64-year group as the reference group. The authors reported that ‘mortality decreased dramatically after 2001’ in all three groups; that reduction was attributed to a tripling of patient entry into the registry since 2001.
Yin and colleagues characterized elderly burn patients treated at a Burn Center in Shanghai.47 In 201 patients with a mean age of 69.3 years (range 60–90 years), the majority were men; flame was the cause of burn in 53% and scalds in 40%. Almost three-quarters (73.6%) of the burns were sustained in the home, and the median extent of burn was 12% TBSA. The areas most frequently involved, in decreasing order, were the legs, arms, head, neck, and hands. Surgical intervention was undergone in 87 patients and 16 (8%) of the entire group died. Morita et al.48 contrasted the characteristics and outcomes in 35 patients of 65 years and over with those of 41 adult patients of lesser years. The average age of the elderly patients was 78 years, and 24 of the 35 had pre-existing comorbid conditions. Compared with the younger adult patients, the elderly had a higher incidence of accidental bath tub-related burns and a lower incidence of suicide attempts. ‘Severe burns’, defined as partial-thickness burns of 30% or more TBSA, or full-thickness burns of 10% or more TBSA, were fatal in the elderly patients.
The disabled
The disabled are a group of patients considered to be burn prone. The majority of burns in the disabled occur at home and are most often scalds. The effects of disability and pre-existing disease in those patients are evident in the duration of hospital stay (27.6 days on average) and the death rate (22.2%) associated with the modest average extent of burn (10% TBSA).49 A report on burn injury in patients, generally elderly, with dementia has emphasized the need for prevention measures to reduce the incidence of burn injuries incurred when such patients are performing the activities of daily living.50
Military personnel
In wartime military personnel are at high risk for burn injury, both combat related and accidental. Over the past six decades the incidence of burn injury, which is related to both the type of weapons employed and the type of combat unit engaged, has ranged from 2.3% to as high as 85% of casualties incurred in various periods of conflicts (Table 3.8). The detonation of a nuclear weapon at Hiroshima in 1945 instantaneously generated an estimated maximum of 57 700 burn patients and destroyed many treatment facilities, thereby compromising the care of those burn patients.51 In the Vietnam conflict, as a consequence of the total air superiority achieved by the US Air Force and the lack of armored fighting vehicle activity, patients with burn injuries represented only 4.6% of all patients admitted to army medical treatment facilities or quarters from 1963 to 1975.52 The majority (58%) of the 13 047 burn patients treated in those years were non-battle injuries, only 5536 (42%) being battle injuries. The overall incidence of burns as the cause of injury in all United States military forces in Vietnam during those years may well have been higher. Allen et al.53 reported that during calendar years 1967 and 1968 a total of 1963 military burn patients from Vietnam were admitted and treated at a burn unit established in a United States Army General Hospital in Japan. In accordance with the data from US Army hospitals in Vietnam, the burns in 847 (43.2%) of those patients were the result of hostile action. In the Panama police action in late 1989, the low incidence of burn injury (only six (2.3%) of the total 259 casualties had burns) has been attributed to the fact that the action involved only infantry and airborne infantry forces using small arms weaponry.
Table 3.8 Incidence of burn injury in armed conflicts
| Conflict | Casualties | |
|---|---|---|
| (%) | n | |
| World War II – Hiroshima40 | 65–85 | 45 500–59 500 |
| Vietnam conflict 1965–197347 | 4.6 | 13 047 |
| Israeli Six-Day War 196746 | 4.6 | |
| Yom Kippur War 197343 | 10.5 | |
| Falkland Islands War 1982 | ||
| British casualties45 | 14.0a | 112 |
| Argentinian casualties47 | 17.5 | 34 of 194 |
| Lebanon War 198243 | 8.6 | |
| Panama police action 1989 | 2.3 | 6 of 29 |
| Operation Desert Shield/Storm 1990–1991 | 7.9 | 36 of 458 |
| Operation Iraqi Freedom and Operation Enduring Freedom 2003–June 2011 | 2.0 | 1015 of 50 694b |
a 34% of all casualties from ships. bData from Renz EM, MD, Col. MC, Director U.S. Army Burn Center, Institute of Surgical Research Brooke Army Medical Center Fort Sam Houston, TX, Personal Communication, July 18, 2011 and Directorate for Information Operations and Reports, Department of Defense. Available at: http://siadapp.dmdc.osd.mil/personnel/CASUALTY/eastop.html. Accessed July 20, 2011.
As exemplified by the Israeli conflicts of 1973 and 1982, and the British Army of the Rhine experience in World War II between March 1945 and the end of hostilities in Northwest Europe, the personnel in armored fighting vehicles have been at relatively high risk for burn injury.54,55 Burns have also been common in war at sea. In the Falkland Islands campaign of 1982, 34% of all casualties from the British Navy ships were burns.56 The increased incidence of burn injuries – 10.5% and 8.6% in the Israeli conflicts of 1973 and 1982, respectively, compared to the 4.6% incidence in the 1967 Israeli conflict – is considered to reflect what has been termed ‘battlefield saturation with tanks and anti-tank weaponry.’54,57 The decreased incidence of burn injuries – 8.6% in the 1982 Israeli conflict compared to the 10.5% in the 1973 Israeli conflict – has been attributed to enforced use of flame-retardant garments and the effectiveness of an automatic fire extinguishing system in the Israeli tanks.57 Those factors have also been credited with reducing the extent of the burns that did occur. In the 1973 Israeli conflict, 29% of the patients with burns had injuries that involved 40% or more TBSA, and only 21% had burns less than 10% TBSA. In the 1982 Israeli conflict those same categories of burn represented 18% and 51%, respectively, of all burn injuries. Modern weaponry may have eliminated the differential incidence of burn injury between armored fighting vehicle personnel and the personnel of other combat elements. In the 1982 Falkland Islands conflict, in which there was little if any involvement of armored fighting vehicles, one of every seven and every six casualties in the British and Argentinian forces, respectively, had burns.56,58 Conversely, there were only 36 (7.8%) burn casualties in the total 458 casualties sustained by US Forces in 1990 and 1991 during Operation Desert Shield/Desert Storm, in which there was extensive involvement of armored fighting vehicles.
During the four-year period 1 March 2003–1 March 2007, 540 combat casualties with a mean extent of burn of 16.7% TBSA (range 0.1–95%) were admitted to the US Army Burn Center.59 In 149 (27.6%) of the patients the burns involved more than 20% TBSA and inhalation injury was documented in 69 (13%). The burns were the consequence of an explosion in 342 (63%) of the patients, commonly due to detonation of an improvised explosive device (IED). The mean ISS was 16 or above in 169 patients as a reflection of significant associated injuries. Slightly more than half of the patients (51%) had mechanical trauma, most often fractures, in addition to their burn injuries. Even with the frequent presence of associated mechanical injury, only 30 (6%) of the patients died.
The 24 of the 540 patients who were burned while incinerating waste represented 10% of military burn casualties admitted to the US Army Burn Center.60 Admission of 20 patients with such injuries during the first year of the study period prompted the distribution of a memorandum to military units in the theater of operations. This described the dangers associated with the burning of waste and articulated safety procedures. In the following year only four patients were admitted with such injuries, which represented a statistically significant decrease in the occurrence of such burns.
Aeromedical transport was used to transfer 380 (70%) of the 540 patients with combat-related burns from the US Army Landstuhl Medical Center in Germany to the Burn Center in San Antonio, Texas. Of these transported patients, 48% received mechanical ventilatory support throughout the transfer procedure. The burn patients accompanied by the Army burn flight team arrived at the burn center on average late on the third postburn day, with no in-flight fatalities.59
Injuries caused by IEDs were characterized in a study of 100 consecutive combat casualties admitted to a British field hospital in Iraq during 2006.61 IEDs were the cause of injury in 53 of these, 12 of whom (23%), considered to have been in the trajectory of the exploding projectile, were either killed or died of wounds. Among the 41 survivors, only eight (15%) had burns and two (4%) had primary blast injury. Even though they were sited adjacent to the trajectory of the IED, all but one of the survivors had returned to military employment within 18 months.
Belmont and colleagues62 analyzed the injuries sustained by a US Army brigade combat team of 4122 soldiers deployed to Iraq for 15 months during the ‘surge’ phase of Operation Iraqi Freedom. There were 500 combat wounds in 390 casualties, 12 of whom had burns sustained in explosions. Seven of the burn patients, four with burns of 10–15% TBSA, were aeromedically transferred to a higher echelon of care.
In the past two years (1 July 2009 to 30 June 2011), as the intensity of the conflicts in Southwest Asia has decreased, the number of combat-related burns has decreased and only 93 burn casualties have been transferred and admitted to the Army Burn Center.63 In that period, 79 (85%) of the burns were due to fire/flame, two (2%) were the result of scalds, and 12 cases (13%) had limited and scattered burns in the presence of complex soft tissue injury. During that time another 45 military personnel were admitted with burns unrelated to combat. In that group the burns were due to fire/flame in 35 (78%), scalds in five (11%), electricity in two (4%), and ‘other’ causes in three (7%). Overall, 1015 military patients have sustained burns in Iraq (Operation Iraqi Freedom) and Afghanistan (Operation Enduring Freedom) and received care at the Army Burn Center since March 2003. Those burns represent 2% of all combat casualties.63
A report from the UK confirms the variable admixture of combat and non-combat burns in military personnel.64 During the period 2001–2007 134 UK military personnel were evacuated to the Royal Center for Defence Medicine (RCDM) for the treatment of burn injury. The median age of the patients was 27 years and the mean extent of burn was 5% TBSA, range 1-70% TBSA. Sixty percent of the burns were unrelated to combat and were classified as ‘accidental’, e.g. sustained while preparing hot food and drinks, burning waste, or misusing flammable liquids. There was one fatal electric injury. During 2006–2007, 56 (59%) of the burn patients evacuated to the UK from Iraq and Afghanistan had burns sustained in combat. Those patients represented 5.8% of all combat casualties in the UK military during that time. Their burns were typically of limited extent (mean 5% TBSA) and these patients often had associated mechanized injuries. 25 or 26% of all the burn patients transferred to the RCDM during the study period underwent skin grafting. All of the evacuated patients survived.
In addition to military casualties, the infrastructure breakdown caused by armed conflict increases the injury burden in the indigenous population.65 Information derived from a questionnaire survey administered in 1172 Baghdad households containing 7396 individuals indicated that the respondents could recall 103 injuries as having occurred during a specific 3-month period. Only four of those injuries were fire/burn-related and five were due to ‘electric shock’. In the current conflicts in Iraq and Afghanistan, up to one-third of the admissions to combat-support hospitals are for humanitarian or civilian emergency care. Analysis of 2060 children admitted to combat-support hospitals between 2002 and 2007 revealed that 204 (13.3%) of the 1537 injured patients had burns.66 Almost twice as many children with burn injury were seen in the combat-support hospitals in Afghanistan as in Iraq. The care of such patients, which may revert to the military during armed conflicts, should be considered when planning combat medical support.
Even in peacetime non-combat munitions incidents are common in the US Army. During a 7-year period 742 non-combat munitions incidents were reported in which 894 soldiers were injured.67 The most common types of injury were burns, which occurred in 261 or 26.7% of all the patients injured. The high incidence of burn injury in military personnel in both war and peace will generate a subset of extensively burned patients who will require tertiary burn center care to ensure optimum functional outcome and maximum survival.
Burn etiologies
Burns due to hot liquids may occur in any age group, but 77% of all hot liquid scalds have been reported to occur in children under 3 years of age. Full-thickness injury is present in less than half of patients with hot water scalds, but in 58% of patients with hot oil burns. Young children are most commonly injured by pulling a container of hot water or hot cooking oil onto themselves, whereas older children and adults are most commonly injured by improper handling of hot oil appliances.68–70 The case fatality rate of scald injury is low (presumably owing to the usually modest extent and limited depth of the burn), but scalds are major causes of morbidity and associated healthcare costs, particularly in children less than 5 years of age and in the elderly.
Even though the burns of 30% of all patients requiring admission to a hospital are caused by scalding by hot liquids, flame is the predominant cause of burns in patients admitted to burn centers, particularly in adults.5 The misuse of fuels and flammable liquids is a common cause of burn injury. A retrospective review of admissions to one burn center for the period 1978 to 1996 identified 1011 (23.3% of 4339 acute admissions) as being gasoline related.71 The average total extent of burn was 30% TBSA, with an average 14% full-thickness burn component; 144 of those patients died. The unsafe use of gasoline was implicated in 87% of patients in whom the cause of the burn could be identified, and in 90 (63%) of the 144 fatalities.
The ignition of alcohol and other flammable liquids which are used to kindle coal stoves, barbecue devices, and fireplaces is a cause of burn injury in both developing and developed countries. A review of admissions to a Turkish Burn Center over a 20-year period identified 82 patients who sustained burns when flammable liquids were being used to kindle or accelerate a stove ignited.72 A 10-year review of admissions to a Chinese University Hospital identified 180 patients burned by ignition of alcohol used to kindle household coal stoves.73 A recent report from Scandinavia identified a similar etiology of burns caused by ignition of bioethanol being used to refill a ‘contemporary design’ fireplace.74 The common theme in all three reports is that the person burned was attempting to refill or accelerate an already or still-burning fire within the device.
In one epidemiologic study in New York State in the 1980s, the largest number of admissions in the age group 15–24 years was related to automobiles. Ignition of fuel following a crash, steam from radiators, and contact with hot engine and exhaust parts were the most frequent causes.75 In a review of 178 patients who had been burned in an automobile crash, it was noted that slightly more than one-third had other injuries, most commonly involving the musculoskeletal system, and that approximately one in six had inhalation injury (one in three of those who died).76 A review of patients admitted to a referral burn center revealed that burns sustained while operating a vehicle involved an average of more than 30% TBSA and were associated with mechanical injuries (predominantly fractures) much more frequently than those incurred in the course of vehicle maintenance activities, which involved an average of less than 30% TBSA.77 Automotive-related flame burns can also be caused by fires and explosions resulting from ‘carburetor-priming’ with liquid gasoline; and such burns have been reported to account for 2–5% of burn unit admissions.78
During the 5-year period 2003–2007 fire departments in the United States responded to an average of 287 000 vehicle fires annually.79 Each year those fires caused an average of 1525 burn injuries, 480 burn deaths, and $1.3 billion in direct property damage. Fifty-eight percent of the fire-related deaths were associated with collisions or overturns, which represented only 3% of vehicle fires. Between 1980 and 2008, the number of vehicle fires decreased by 55%, with a proportional decrease in burn deaths and burn injuries. An estimated 207 000 vehicle fires in 2008 caused 350 fire deaths and 850 fire injuries, representing an accumulative 70% decrease since 1980.
Stay updated, free articles. Join our Telegram channel

Full access? Get Clinical Tree


