This article presents a review of 3D video analysis for use in patients with facial paralysis. The difficulties inherent in quantifying the degree of facial paralysis and the effect of therapeutics that has led to the use of videos and computer-assisted 3D analysis are discussed, which can yield quantifiable results of treatment, allow the description and quantification of facial paralysis, and become a tool in the planning of operative procedures. The authors provide a step-by-step overview of video analysis, and present case studies from two specific techniques they have used in reconstruction surgery.
The exact local extent and degree of facial paralysis as well as their implications on the different functions of the mimetic muscle system, on the aesthetic appearance of the face, and on the patient`s sequelae are difficult to assess. The authors’ first experiences with the International Muscle Transplant Registry had shown that the traditional scoring systems for facial palsy are not suitable for an exact and scientific evaluation. As a consequence the authors concentrated research on the possibilities of 3-dimensional (3D) measuring of movements in the face during standardized mimic activities initially using a VICON videosystem, and later a digital caliper (Faciometer) developed in tight cooperation with the Laboratory for Biomechanics of the Swiss Federal Institute of Technology, Zurich.
However, from the beginning it was the authors’ aim to document the facial movements by taking standardized videos and to quantify the facial movements by computer-assisted 3D analysis of the video film. This idea was realized by a completely new development.
Methods
The equipment consists in its entirety of a system for taking videos in front of two special mirrors arranged at a sharp angle, a calibration grid, a digital video camera, and a computer workstation. For this system the video is transferred to the hard disk to prepare the selected sequences by an editing program for analysis. When the real image and the two mirror images in all single pictures have been analyzed point by point by the computer, these final data are stored on a compact disk (CD). A visualization program gives easy access to the stored data.
Taking the Video
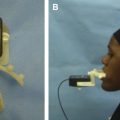
At first the standardized static and dynamic points to be measured are marked in the face. The 3 static points (tragus points of both sides and the central nose point) define a triangle, to which all dynamic points are related during the facial movements. The definitions of the static and dynamic points are explained further in an article published in 1994. To calibrate the system a calibration grid is brought between the two mirrors and is filmed. Afterwards, the head of the patient is positioned between two mirrors arranged at a sharp angle. By this method a frontal image and side-view mirror images from the left and right side of the patient`s face are taken by the camera, including all marked points. All standardized facial movements are now recorded by the video camera 3 times:
- 1.
Maximal lifting of the eyebrows
- 2.
Closing of the eyes as if for sleeping
- 3.
Maximal closing of the eyes
- 4.
Maximal showing of the teeth
- 5.
Maximal closing of the eyes and showing of the teeth at the same time
- 6.
Smiling with showing the teeth
- 7.
Smiling with closed lips
- 8.
Pursing the lips and whistling
- 9.
Pulling the corners of the mouth downwards.
To document the influence of the facial palsy on speech the video with sound track is continued, while the patient counts from 1 to 10 and pronounces his or her name and address.
3D Analysis of the Video
After transferring the digital video film from the camera to the computer picture by picture, all static and dynamic points of the face in the frontal and the two mirror views are marked with the cursor of the mouse in a constant order indicated by the program. The measurement has to be calibrated by doing the same to one picture of the calibration grid and its two mirror images. After this has been done for all standardized facial movements, the data are recorded on a CD.
Visualization of Patient Data
A visualization program gives easy access to the data. The change of the distance over time of any 2 standardized points can be shown on a graph for each of the standardized movements and for both sides of the face. An exact measurement can be performed at each phase of the movement. Parallel to this a video clip of this movement can be reviewed, or the picture of the resting face and the picture of the maximum of this movement can be seen. A qualitative documentation in the video clip occurs in parallel with a quantitative measurement.
By way of 2-dimensional (2D) graphs, the movement of each dynamic point is visualized for each of the movements. The movement of all points can be shown 3-dimensionally at the same time and for each of the standardized facial movements.
Changes in speech can also be observed on the acoustic track by comparison of the recordings during the different video sessions.
Related posts:
 Foreword
 3D and the Next Dimension for Facial Plastic Surgery
 The Use of 3D Imaging Tools in Facial Plastic Surgery
3D Analysis of Tissue Expanders
Evolution of 3D Surface Imaging Systems in Facial Plastic Surgery
The Use of 3D Imaging Tools in Facial Plastic Surgery
3D Analysis of Tissue Expanders
Evolution of 3D Surface Imaging Systems in Facial Plastic Surgery
 3D Volume Assessment Techniques and Computer-Aided Design and Manufacturing for Preoperative Fabrication of Implants in Head and Neck Reconstruction
Stay updated, free articles. Join our Telegram channel

Full access? Get Clinical Tree


