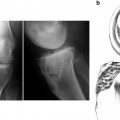
Fig. 25.1
Trend of increasing numbers of Revision ACL Reconstructions as reflected by single institutions in Miami (a) and Germany (b). (a) Reprinted with permission from Uribe JW, Hechtman KS, Zvijac JE, Tjin-A-Tsoi EW. Revision anterior cruciate ligament surgery: experience from Miami. Clin Orthop Relat Res. 1996;(325):91–9. (b) Reprinted with permission from Wirth CJ, Kohn D. Revision anterior cruciate ligament surgery: experience from Germany. Clin Orthop Relat Res. 1996;(325):110–5
As with any other orthopedic procedure, revision surgery is technically more challenging, takes longer to perform, and is often associated with more complications and worse outcomes. With specific regard to revision ACL surgery, there are many variables that have been proposed to contribute to poorer outcomes of RACLR compared to PACLR:
Increased number of instability episodes
Residual contractures or motion deficits
Increased technical difficulty with dissection and graft harvest due to scar tissue
Increased chronicity of ACL deficiency
Increased incidence and severity of concomitant meniscus injury
Increased laxity in secondary stabilizers
Increased incidence and severity of concomitant articular cartilage injury
Increased patient age and comorbidities
Increased technical difficulty with proper tunnel placement
Increased technical difficulty with graft fixation
Limited autograft options
Staged procedures
Decreased bone stock available for graft fixation
These potential variables, coupled with the fact that RACLR is much less common than PACLR, contribute to the difficulty in performing highly powered and well-designed research studies of RACLR outcomes. Such studies will be important to identifying key variables and improving outcomes of revision surgery going forward. The current body of literature consists of a few dozen publications whose design, evaluation methodology, and surgical techniques are so variable that a meta-analysis on the subject is challenging to complete. As it stands today, it remains difficult to accurately predict how a patient will do after RACLR, which patients should anticipate a return to sports or activity at their pre-injury level, and which patients are likely to go on to develop arthritis or need more surgery. Other important topics that likely affect outcomes in RACLR that have yet to be definitively investigated include graft selection, surgical techniques, and the exact impact of concomitant articular or meniscal injury.
Outcome Measures
There are several outcome measures commonly used when assessing ACL surgery, analyzing both subjective and objective data. While these measures easily translate to the revision setting, there are no universally accepted set of outcome measures used in RACLR data collection that would easily facilitate comparative research or even a meta-analysis. Subjective outcome measures that have been validated and widely used for ligament knee assessment include the Lysholm knee score, the Tegner activity score, the International Knee Documentation Committee (IKDC) subjective score and the Marx Activity Scale. [9–16]. The Lysholm scale was introduced in 1982, consists of eight questions, and evaluates knee instability [12]. It is physician administered, does not include a physical examination, and focuses on the patient’s perception of function in both activities of daily living and sporting activity. The Tegner scale was published in 1985 and uses 11 assessments to help predict return to activity or sport [13]. Together, the Lysholm and Tegner scores complement patient perception of function and activity level. Figure 25.2 shows the Marx Activity Scale. It was introduced in 2001 and is different from other activity scales because it focuses on the patient’s functional level, and is not sport-specific [16]. Furthermore, it focuses on activities that are difficult for someone with pathologic conditions of the knee [16]. The IKDC system was introduced in 1987 by physicians from both the USA and Europe [14]. It was developed secondary to concerns that other scoring systems used numerical values to reflect data that was not quantifiable [14]. The current modified form now has four sections: subjective assessment, symptoms, range of movement, and stability. The IKDC is now more widely used in conditions of knee disability other than instability, including assessment of articular cartilage [10, 11, 17, 18].
Fig. 25.2
Marx Activity Scale. Reprinted from: Marx RG, Stump TJ, Jones EC, Wickiewicz TL, Warren RF. Am J Sports Med. 2001;29(2):213–8; with permission of Sage
Objective outcomes commonly used to evaluate ACL surgery include the IKDC objective score, ability to return to play (or activity level), KT-1000 and KT-2000 (MEDmetric, San Diego, CA) measurements, radiographic analysis of tunnel placement and for signs of arthritis, and need for additional surgery. The IKDC activity level is scaled 0–4 as follows: Level 0 = unable to perform activities due to knee pain, swelling, or instability; Level 1 = light activities such as walking, housework, or yard work; Level 2 = moderate activities such as moderate physical work, running, or jogging; Level 3 = strenuous activities such as heavy physical work, skiing, or tennis; and Level 4 = very strenuous activities such as jumping or pivoting as in basketball or soccer. The KT-1000 and KT-2000 arthrometers have provided quantitative information on laxity in the AP direction, such as observed during the Lachman or Anterior Drawer exam maneuvers. However, no such clinical device or arthrometer has been developed and widely put into clinical practice to provide quantitative information for rotational laxity, such as during the Pivot Shift exam. There is growing evidence that the Pivot Shift and rotational stability may better predict long-term surgical outcome than assessments of translation in the sagittal plane [19, 20].
Outcomes of RACLR
Tables 25.1 and 25.2 summarize the subjective (Table 25.1) and objective (Table 25.2) results of selected RACLR studies performed over the last 20 years. The earliest reports on RACLR outcomes were published together in Clinical Orthopedics and Related Research in 1996 and described institutional results of RACLR from Miami, Pittsburgh, Cincinnati and one international group from Germany [1, 2, 8, 21]. This group of papers drew attention to the increasing need for revision surgery and the fact that RACLR is technically challenging with many variables affecting outcomes. These reports also indicated that the results of RACLR are likely inferior and less predictable than primary reconstructions. Importantly, these papers increased awareness of the peculiarities of RACLR and led to other institutions reporting their respective results.
Table 25.1
Subjective ACL revision outcome results from selected studies
Authors | Year of publication | Number of cases | Mean time to follow up (years) | Mean IKDC | Mean Lysholm | Mean Tegner |
|---|---|---|---|---|---|---|
Uribe et al. [2] | 1996 | 54 | 2.5 | – | 83 | 5.5 |
Johnson et al. [8] | 1996 | 25 | 2.3 | – | – | – |
Wirth et al. [1] | 1996 | 87 | 8 | – | 68 | – |
Grossman et al. [24] | 2005 | 29 | 5.6 | 84.8 | 86.6 | 5.2 |
Battaglia et al. [5] | 2007 | 63 | 6.1 | 73.6 | – | – |
Diamanto-poulos et al. [7] | 2008 | 107 | 6.1 | – | 88.5 | 6.3 |
Reinhardt et al. [25] | 2011 | 21 | 3 | – | 89 | – |
Table 25.2
Objective ACL revision outcome results from selected studies
Authors | IKDC | KT side-to-side difference | Return to play | X-ray arthritis | Further surgery |
|---|---|---|---|---|---|
Uribe et al. [2] | – | Mean = 2.8 mm Autografts: 2.2 mm Allografts 3.3 mm | 54 % | 19 % progressive changes | – |
Johnson et al. [8] | A/B: 12 % C: 52 % D: 36 % | ≤3 mm: 20 % >3 to ≤5 mm: 44 % >5 mm: 36 % | 68 % | – | – |
Wirth et al. [1] | – | – | – | Fairbank grade 0: 36 % I: 55 % II: 7 % III–IV: 2 % | – |
Grossman et al. [24] | A: 58 % B: 28 % C: 14 % | Mean = 2.78 mm Autografts: 1.33 mm Allografts 3.21 mm | 80 % (4/5) | 44 % “mild” or “moderate” in medial compartment | 3 % |
Battaglia et al. [5] | – | Mean = 3.9 mm <3 mm: 51 % | 59 % | 25 % | 25 % |
Diamanto-poulos et al. [7] | A: 16 % B: 42 % C: 35 % D: 7 % |