Fig. 4.1
Fat necrosis on mammography (lateral view) shows a “rim-like” or “egg-shell” type of calcification (arrow) within the fatty tissue of the breast
4.2.2 Ultrasound
Also called sonography, this widely available imaging method is based on the properties of sound waves and has been increasingly used for studying fat necrosis in soft tissues due to the high definition images of the superficial layers provided by the current machines. Besides its non-radiating nature and proved safety characteristics, there are several advantages of ultrasound such as its real time, 2D and 3D multiaxial and dynamic performance, as well as its reasonable balance between resolution and penetration that allow us to obtain a wide range of anatomical information that can reach from the skin layers to the bony margin. Also, ultrasound can show the vascularity of the tissues through its color or power Doppler capabilities which includes the detection of the type of vessel (arterial or venous) and the velocity of blood flow (cm/s) [4, 5]. This may avoid the adverse reactions due to the use of contrast media that have been widely reported with other imaging modalities such as CT or MRI. The current limitations of ultrasound are lesions that measure <0.1 mm, with only epidermal location, and the detection of pigments such as melanin [6]. These last two limitations are not relevant for the study of fat necrosis. In fact, the hypodermis seems to be a perfect target for ultrasound use, due to its anatomically superficial location in soft tissue that makes it easily accessible with most of the linear probes that work with frequencies ≥7.5 MHz. Nevertheless, probes working with higher frequencies (≥12 MHz) are most commonly recommended for studying the hypodermis due to their higher definition at this tissue depth. On ultrasound, the most common sign of fat necrosis is the presence of well-defined round or oval-shaped anechoic pseudocystic structures, frequently with posterior acoustic enhancement, and sometimes surrounded by a hyperechoic calcified rim. These pseudocystic structures correspond to the oily cysts produced by the liquefaction of the fatty tissue. Internal echoes and a fluid–fluid level may sometimes be recognized in these pseudocysts, usually in cases with history of trauma where the serohematic material combines with the liquefied material of the fatty lobules. Also, increased echogenicity of the hypodermis and isoechoic pseudonodules, surrounded by an anechoic or hypoechoic halo, may be detected. These latter ultrasound features indicate the degree of hypodermal inflammation. Less frequent sonographic signs are anechoic masses with a posterior acoustic shadowing artifact due to gross calcification and well- or ill-defined hypoechoic solid pseudo-masses due to prominent fibrosis and scarring. All these characteristics may appear as single or combined features in the affected region (Figs. 4.2 and 4.3). Hypo- or hypervascularity in the hypodermis may be detected according to the level of inflammation present in the tissue, hypervascularity being the most commonly found in inflamed stages [1, 3, 7]. In cases presenting subcutaneous fat necrosis of the newborn, ultrasound has been reported to successfully support the diagnosis [8–10]. Thus, the main indications for ultrasound in fat necrosis are to support the early diagnosis and rule out solid tumors that may be hard to differentiate on a clinical basis only.
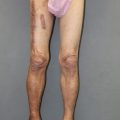
Fig. 4.2
Fat necrosis on ultrasound (gray scale, transverse views) demonstrates the wide range of appearance of this condition. Symbols: * pseudocyst, o pseudonodule, x fibrosis, arrow calcification, 1 and 2 fluid–fluid level. Abbreviations: d dermis, h hypodermis
Fig. 4.3
Fat necrosis on 3D ultrasound (gray scale, 5–8 s reconstruction, transverse views) shows variable forms of presentation. Symbols: * pseudocyst, o hyperechogenicity (top) and pseudonodule (middle and bottom location), arrows pointing out the lesional sites. Abbreviations: d dermis, h hypodermis
4.2.3 Magnetic Resonance Imaging
This is an imaging method based on the response of the body’s hydrogen ions in a magnetic field. This technique has been widely used in the study of soft tissues, mainly in the musculoskeletal field, due to its high definition anatomical images. The main disadvantages of this method are its high cost and the potential adverse reactions to gadolinium, the usual contrast medium used in these examinations. Additionally, MRI has limited ability to show small calcifications, a common finding in fat necrosis which may be seen in this imaging technique as areas of signal void or may simply go undetected. On MRI, a wide spectrum of findings has been reported in fat necrosis and some of the findings may even mimic a malignant tumor such as a breast cancer. The most typical finding on MRI is a round or oval nodule or mass with hypointense T1-weighted signal on fat-saturated images that correspond to a lipid pseudocyst. Also, fat necrosis can show as well- or ill-defined isointense or hypointense areas or pseudonodules on T1-weighted images probably due to its inflammatory and hemorrhagic characteristics. In case with strong fibrosis, architectural distortion, with or without spiculated margins, and variable degrees of intensity (low, intermediate, or high signal) on T1-weighted images are reported. Fat suppression sequences may help to differentiate fat necrosis from malignant tumors. On T2-weighted sequences, isointense, hypointense, and hyperintense appearances have been described. Pseudonodular, globular, and laminated appearances have been additionally reported (Fig. 4.4). After the injection of gadolinium contrast medium, fat necrosis can show variable appearances that can range from no enhancement to irregular or peripheral enhancement and from thin to thick rims of enhancement [1–3, 7, 11, 12]. The most frequent indications for MRI regarding fat necrosis are to complete the imaging study in cases with mammographic abnormalities, especially the ones where a malignancy must be ruled out, and to assess the differential diagnosis in cases presenting palpable large lumps or extensive trauma.
Fig. 4.4


(a, b). Fat necrosis on MRI (axial views). (a) T1-weighted sequence shows isointense pseudonodule with a hypointense rim located in the hypodermis of the right side of the lower back (arrow, fat necrosis area). In the vicinity, a hypointense oval-shaped hypodermal structure is detected that corresponds to a hematoma (hm). (b) T2-weighted image of the same case shows a change in the intensity of the hematoma (hm) with a fluid–fluid level (hyperintense/hypointense) and no change in the intensity of the pseudonodule (arrow, fat necrosis site) in comparison with the T1-weighted sequence (Courtesy of Drs. Raul Valenzuela and Herly Pulgar)
Related posts:
Stay updated, free articles. Join our Telegram channel
Full access? Get Clinical Tree
