Fig. 6.1
Cutaneous melanoma with BRAF V600E mutation. Single point mutation involving DNA base substitution from thymine to adenine (T to A) (*) that converts amino acid valine (V) to glutamic acid (E) at the 600 amino acid position
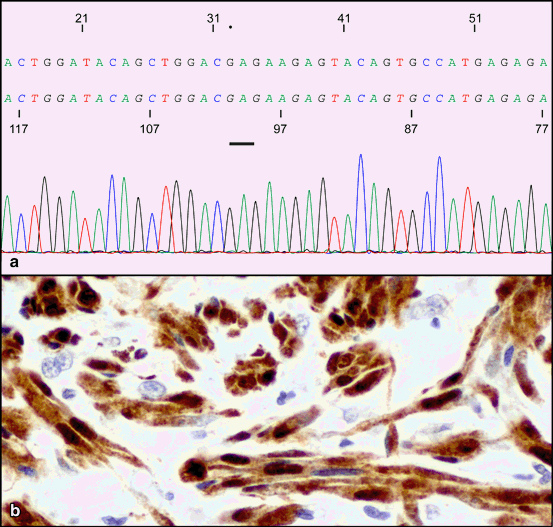
Typically, NRAS and BRAF mutations appear mutually exclusive; however, there are small percentages of melanomas that may harbor both NRAS and BRAF mutations (Fig. 6.2). In one study, double mutant NRAS and BRAF melanomas accounted for approximately1.3 % of the cases analyzed [24, 34, 35]. On rare occasions melanomas may harbor combinations of other multiple mutations such as NRAS with PIK3CA or CTNNB1 or BRAF with PTEN, AKT1, or CTNNB1 [29].


Fig. 6.2
Cutaneous melanoma with both BRAF V600E and NRAS Q61R mutations. A BRAF V600E point mutation was present, similar to Fig. 6.1 and in addition a Single point mutation involving DNA base substitution adenine to guanine (A to G) in codon 61 of NRAS (bar) gene that converts amino acid glutamine (Q) to arginine (R). b Invasive melanoma composed of nest of tumor cells with spindle shaped morphology. Tumor cells are reactive for S100 (nuclear and cytoplasmic reactivity)
Genetic Mutations in KIT
KIT is a tyrosine kinase growth factor receptor and KIT mutations and/or increased copy numbers are seen in acral lentiginous/mucosal melanomas and melanomas in skin with chronic sun damage (CSD) and ranges from 15 to 20 % of mutations in this type [36, 37]. Some studies did not reveal elevated instances of KIT mutations in CSD and additional studies are needed for clarification [38]. KIT mutation promotes ligand-independent KIT dimerization and constitutive activation of MAPK and PI3K-AKT pathways to promote proliferative and survival advantage for melanoma cells [39, 40]. Most mutations in KIT in melanomas occur on exon 11, which are also seen in gastrointestinal stromal tumor (GIST), but mutations in exons 13 and 17 are also relatively common in melanoma [41, 42]. Although, melanomas and GIST may demonstrate overlapping mutation spectra in KIT, there are distinct differences. The majority of exon 11 mutations in melanomas are substitution mutations in contrast to deletions or insertion mutations seen in GIST [43]. Exon 9 mutations are seen in up to 15 % of GIST but are infrequent in melanomas and increase in KIT copy number or amplification may occur in 30 % of a subset of melanomas while such findings are rarely observed in GIST [29, 44].
Genetic Mutations in GNAQ/GNA11
GNAQ and GNA11 encode for the α-subunit of G-protein-coupled receptor. Mutations in GNAQ in melanocytic lesions exclusively occur at codon 209 with subsequent amino acid changes of glutamine to leucine or proline (Q209L or Q209P). GTP hydrolysis is prevented in mutant forms of GNAQ, thus resulting in a constitutive activation of this G-protein. A subset of benign and malignant melanocytic lesions harbor GNAQ mutations and similar to BRAF and NRAS mutations appear to be an early event in MAPK activation since mutations in GNAQ alone appear insufficient for melanomagenesis. GNAQ mutations have been detected in 83 % of blue nevi, 50 % of melanoma with blue nevus features, 46 % of uveal melanoma, and in 4 % of melanomas on chronically sun-damaged skin [45]. GNA11 Q209 mutations occur in only 7 % of blue nevi. Similar percentages of GNAQ and GNA11 mutations were observed in uveal melanomas, 46 and 32 %, respectively [46].
Molecular Platforms in Melanoma Mutation Analysis
Multiple sequencing molecular platforms are available to examine for BRAF, NRAS, KIT, and GNAQ/GNA11 mutations in cutaneous melanomas. Sanger chain termination sequencing of amplified DNA (deoxyribonucleic acid) by polymerase chain reaction (PCR) led to the detection of BRAF, NRAS, and KIT mutations in cutaneous melanoma. Mutation analysis by Sanger sequencing provides complete sequence between the sequencing primer pairs and allows for the detection of DNA base pair substitutions, deletions, and insertions. Changes in chromosomal copy number and translocations cannot be detected by Sanger sequencing method [47]. Since recurrent mutations in melanomas appear to be clustered at particular genomic hot spots, pyrosequencing, allele-specific real-time polymerase chain reaction (RT-PCR), RT-PCR melting curve analysis, and mass spectroscopy-based mutation analysis allowed for faster, more sensitive methods in detection of predetermined hot spot mutations in cutaneous melanoma. Screening genes for nonrecurrent mutations in melanoma will require alternative molecular techniques and next generation sequencing platforms which will allow whole genome sequencing [47].
Of the known mutations to occur in cutaneous melanoma, BRAF V600E mutation appears to account for the highest percentage of mutations in cutaneous melanoma. The Cobas 4800 V600 mutation test by Roche is a Food and Drug Administration (FDA) approved in vitro diagnostic device for evaluation of BRAF V600E mutation in formalin-fixed paraffin-embedded tissue samples of melanoma. The sensitivity of detecting BRAF V600E by Cobas 4800 is reported to be greater than 99 % with a specificity of 88 % and the device is intended to identify patients who may benefit from therapy with selective BRAF inhibitor (BRAFi) vemurafenib [48].
Amplification of DNA by PCR remains central in evaluating for genomic mutations in melanoma. Melanin pigment is a known inhibitor of PCR and on occasion evaluation of tissue samples for mutation analysis may yield no results due to non-amplifiable DNA [49]. This may become an issue with melanomas that are heavily pigmented. One possible way to circumvent this problem is to repeat mutational analysis on tumor specimens from different blocks and/or different tissue sources from a patient if other material is available. Otherwise, there is a small subset of tumors where mutation analysis cannot be obtained despite repeat analysis and techniques to overcome melanin inhibition.
Dysplastic Nevus (DN) Syndrome and Familial Melanoma
The search for altered genes that could underlie the development of familial melanoma has directed investigations at the CDKN2A/INK4A gene on chromosome 9p21 which codes for a cyclin-dependent kinase inhibitor (CDKI) protein, p16INK4a [50]. The CDKN2A/INK4A gene is a major melanoma susceptibility locus associated with familial melanoma and dysplastic nevus (DN) syndrome or familial atypical multiple mole melanoma (FAMMM) [51–53]. The importance of tumor suppressors like p16INK4a as potential barriers to the development of melanoma has been illustrated in cell cultures and human tissue [54, 55]. Upregulation of p16INK4a was seen to inhibit normal melanocyte growth in culture and loss of replicative potential in melanocytic nevi [31, 33]. In a subset of patients, oncogene-induced cellular senescence appears to be an important barrier against further nevus growth and formation of cutaneous melanoma in a subset of patients.
Genetic alterations in acquired DN appear complex and include loss of tumor suppressor genes and altered function of oncogenes, housekeeping genes, growth factors, and extracellular matrix proteins. Molecular analyses have suggested that there may be alterations in the same set of susceptibility genes in DN and cutaneous melanoma. A thorough review of the molecular aspects of dysplastic nevi is available by Hussein et al [56]. In summary, dysplastic nevi may manifest from karyotypic alteration in chromosome 1p and 9p, allelic loss at chromosome 1p, 9p, and 17p, loss of tumor suppressor genes, p16/CDKN2A and p53, microsatellite instability, alterations in mismatch repair proteins, activation of B-raf, ras, and myc oncogenes, and alterations in extracellular matrix proteins (collagen type I, III, VI, tenascin, and fibronectin) and cytokines/growth factors [56].
Applications of Molecular Techniques in Diagnosis
Immunohistochemistry
The use of immunohistochemistry when evaluating melanocytic lesions may become necessary when the distinction between various types of benign melanocytic nevi and melanoma is not readily apparent upon examination of hematoxylin and eosin (H&E) stained sections. The standard antibodies used in dermatopathology practice for these types of lesions include S100, HMB-45 (anti-gp100), anti-MART-1, and MIB1 (anti-Ki67) [57–59].
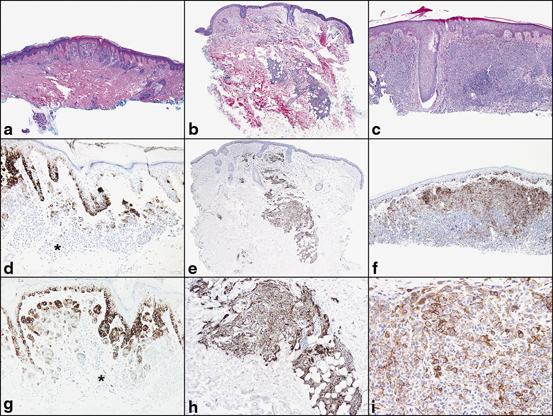
HMB-45 and anti-MART-1 label intraepidermal melanocytes and thus the extent of upward pagetoid upward migration of melanocytes in the epidermis may be highlighted with either of these antibodies. Benign melanocytic nevi will demonstrate maturation sequence or loss of HMB-45 labeling with progressive descent into the dermis (Fig. 6.3). Exceptions to this pattern of labeling with HMB-45 in benign lesions include blue nevi and subset of Spitz nevi. These two lesions may demonstrate a diffuse labeling pattern with respect to HMB-45 (Fig. 6.3). In contrast, melanomas will consistently demonstrate a patchy pattern of labeling with HMB-45 (Fig. 6.3).


Fig. 6.3
Pattern of HMB-45 labeling in a melanocytic nevi, b Spitz nevi, and c invasive melanoma. HMB-45 labels melanocytes in the epidermis and in the papillary dermis and superficial reticular dermis. d and g There is loss of HMB-45 labeling (normal maturation pattern in benign melanocytic nevi) with progressive descent into the deep reticular dermis (*). e and h Spitz nevi may demonstrate normal maturation pattern with respect to HMB-45 or a diffuse, uniform pattern of labeling. f and i Contrast to invasive melanoma with patchy labeling of HMB-45
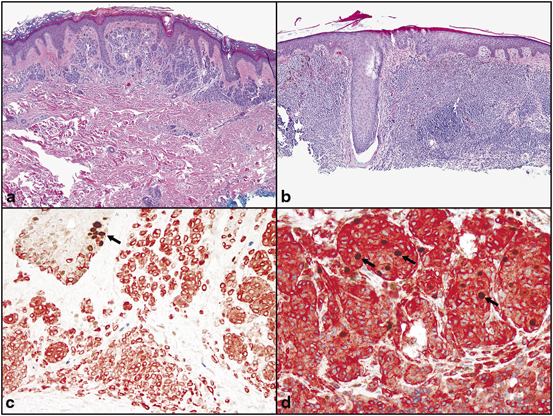
Evaluation of the proliferative rate of the dermal component of melanocytic tumor is measured by Ki-67. This marker also aids in the distinction between benign and malignant melanocytic proliferations. Benign melanocytic nevi (ordinary, Spitz, and dysplastic) demonstrate less than 1–10 % labeling with MIB1 (anti-Ki-67). However, melanomas demonstrated a proliferative rate up to 16.4 % with MIB1 and absence of orderly pattern of labeling in the dermis [60]. Double labeling with MART-1 (cytoplasmic, red reactivity)/Ki-67 (nuclear, brown reactivity) enhances the evaluation of proliferative index in melanocytes, and is particularly useful in lesions with a high number of background lymphocytes (Fig. 6.4) [59].


Fig. 6.4
Proliferative index of a melanocytic nevi and, b invasive melanoma with double stain Mart-1/Ki-67. c Melanocytic nevi demonstrate a low proliferative index of the dermal melanocytes (Mart-1 positive cells, red, cytoplasmic reactivity). The dermal melanocytes demonstrate absence of labeling with Ki-67 (brown, nuclear reactivity). Basal keratinocytes serve as a positive internal control for Ki-67 labeling (arrow). d Invasive melanoma with increase proliferative rate with many Mart-1 (red, cytoplasmic labeling)/Ki-67 (brown, nuclear labeling) positive cells (arrows)
Macrophages may be reactive with anti-MART-1 and may be interpreted as invasive melanoma cells [61]. Melanocytic nevi uniformly label with anti-MART-1 whereas desmoplastic melanoma may demonstrate weak, variable expression for MART-1 antibody.
Comparative Genomic Hybridization
Chromosomal abnormalities have been recognized in melanoma for decades [62–68]. The advent of CGH enabled a systematic characterization of melanoma at the genomic level. In traditional CGH, DNA derived from a tumor of interest is labeled with a discrete fluorochrome and mixed together with an equimolar amount of reference DNA labeled with a different fluorochrome. This mixture is hybridized onto denatured metaphase chromosomal spreads in the conventional method or onto an array containing serially arranged portions of DNA representing the entire genome in the array platform. Chromosomal gains in the tumor sample are represented by increased tumor-specific fluorochrome at a specific locus while losses in the tumor exhibit increased reference-specific fluorochrome at that site.
A critical development in our understanding of the pathogenesis of melanoma came from the work of Bastian and colleagues who initially utilized CGH to describe chromosomal gains and losses in primary melanomas from 32 patients [69]. They identified that primary melanomas were typified by multiple gains and losses in discrete regions of the genome. Subsequently, CGH was applied to a series of melanomas (n = 132) and melanocytic nevi (n = 54) to demonstrate a distinct pattern of chromosomal aberrations in melanomas not present in nevi. Whereas greater than 95 % of melanomas demonstrated some degree of chromosomal copy number aberration, only a rare subset of melanocytic nevi (13 %, all of which were Spitz nevi) demonstrated a single isolated gain of the entire short arm of chromosome 11—a change not seen in any of the melanomas analyzed [70]. Furthermore, central to the distinction between melanomas and nevi (of varying sorts) as demonstrated by CGH is the fact that melanomas contain gains and/or losses in partial regions of the chromosome, whereas when nevi contain alterations, they typically involve whole chromosomes or whole chromosomal arms. CGH not only distinguishes between melanomas and nevi, but also demonstrated discrete, reproducible differences among melanomas of varying subtypes. In a landmark study, Bastian and colleagues further used CGH to demonstrate that melanomas of varying subtypes (grouped according to whether they arose on or sites with or without chronic sun exposure) demonstrated distinct patterns of genomic alterations, including the frequency of oncogene mutations as well as differences in chromosomal aberrations. These findings argue that melanoma is a heterogeneous disease, arising through different mechanisms, which are a function—at least in part—of their anatomic location and the degree of antecedent ultraviolet light exposure [22].
Because CGH simultaneously scans the entire genome for all possible copy number alterations, it has considerable promise as a diagnostic tool in melanocytic tumors. However, there are many practical issues that limit the utility of CGH in a routine diagnostic setting. First, it requires a relatively large amount of pure tumor cells which can be difficult to obtain in some lesions and could compromise a thorough histopathologic assessment of a lesion. Lesions with relatively few tumor cells or lesions with a high degree of admixed inflammatory or stromal cells are also less amenable to CGH analysis because the DNA obtained from the non-tumoral cells can obscure the chromosomal abnormalities present in the background tumor cells. In addition, the abnormality must be present in a sufficient number of tumor cells to be detectable in the analysis. Finally, the DNA obtained must be suitable for subsequent enzymatic manipulations for fluorescent labeling reactions [71, 72].
Fluorescence In situ Hybridization
The limitations of conventional and array CGH necessitated the development of an assay that exploits the differences among melanocytic tumors described by CGH, but which is more amenable to routine clinical practice. FISH offers important advantages over CGH as a routine and practical clinical assay. FISH utilizes fluorescently labeled probes corresponding to discrete chromosomal locations that are hybridized to routine (5µm) formalin fixed paraffin embedded tissue sections.The number of fluorescent signals per nucleus (described as “dots”) is counted, and aberrations are described as a percentage of tumor nuclei carrying greater or fewer than two signals. FISH offers the ability to evaluate copy number aberrations at a cellular level and further, to correlate any changes in copy number at particular locus (corresponding to a specific fluorescent probe) with cellular morphology under conventional light microscopy .
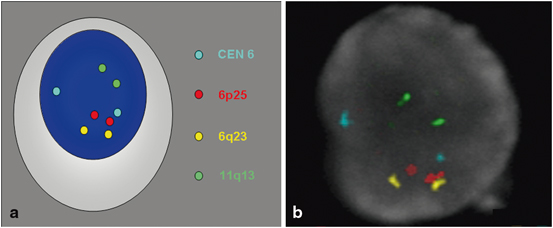
The FISH assay for melanoma evolved directly from the CGH studies of Bastian and colleagues [73]. A retrospective analysis of the original CGH data from the series of 186 of primary melanomas and nevi identified 13 loci spanning 8 different chromosomes which in varying combinations best discriminated between melanomas and nevi. FISH probes corresponding to these regions were chosen and configured into different panels of probe combinations and applied to a series of melanomas and nevi to determine the optimum combination. Four probes were identified that appeared to yield the most effective distinction between melanomas and nevi: RREB1 or 6p25 (red dot), CEN6 or centromere 6 (aqua dot), MYB or 6q23 (yellow dot) and CCND1 or 11q13 (green dot; Fig. 6.5). The centromere 6 probe is used to quantitate relative gains (or loss) of the other loci on this chromosome. Further studies generated the following algorithm that best discriminated between melanomas and nevi: (1) more than 38 % of the tumor nuclei contain greater than 2 signals for 11q13 or, (2) more than 29 % of tumor nuclei contain greater than 2 signals for 6p25 or, (3) more than 55 % of the tumor nuclei contain more 6p25 signals than centromere 6 signals, or (4) more than 40 % of the tumor nuclei contain fewer 6q23 signals than centromere 6 signals. Positivity for any of these parameters was determined as a positive test for melanoma. Numerous studies have subsequently tested the applicability of this FISH assay as a proof of principle in the distinction between histopathologically unambiguous melanomas and nevi (Table 6.1) [74–77]. Additional studies have described the applicability of the FISH assay to different histopathological settings, including lentiginous junctional melanoma of the elderly [76]; blue nevus-like metastatic melanoma versus epithelioid blue nevus [78]; metastatic melanoma to lymph node versus intranodal nevus [79]; pagetoid melanocytosis as a distinctive subtype of melanoma [80]; nevoid melanoma versus benign melanocytic nevus [81]; conjunctival melanomas versus conjunctival nevi [82]; desmoplastic melanomas versus sclerosing melanocytic nevi [83]; and blue nevus-like melanoma versus cellular blue nevi [84]. From these preliminary studies, the overall sensitivity of FISH in distinguishing among melanomas and nevi of the indicated subtypes from various anatomic locations was ~ 80 % with an overall specificity of > 90 %. However, it is important not to overestimate the value of FISH in a routine diagnostic setting since an important and often understated limitation inherent to the above studies was their reliance on histopathologically unambiguous melanomas and nevi to determine the utility of FISH. In morphologically unambiguous lesions, an experienced dermatopathologist would rarely—if ever—exclusively rely on a FISH assay for diagnostic purposes. An important question for the FISH assay thus became whether the FISH assay was applicable to histopathologically ambiguous lesions. In their original study, Gerami et al. applied the FISH assay to 27 ambiguous lesions—6 of which developed metastases and 21 of which were “event free” with a follow-up period of at least 5 years [73]. Of these cases, all 6 primary tumors that eventually developed metastases were FISH-positive, while only 6 of the 21 cases without metastases were FISH-positive. The latter observation was interpreted as melanomas that were either cured by excision or inadequately followed to detect their eventual metastases, while the former was interpreted as a high degree of sensitivity of FISH in identifying bona fide melanomas .


Fig. 6.5
Normal FISH analysis with four probe melanoma cocktail (CEN 6 = aqua dot, RREB1 or 6p25 = red dot, MYB or 6q23 = yellow dot and CCND1 or 11q13 = green dot). a cartoon, and b FISH of normal nuclei with two pairs of each probe is used in the four probe melanoma cocktail
Table 6.1
Sensitivity and specificity of FISH in various types of melanocytic nevi and cutaneous melanoma
Lesion type | Melanomas tested | Melanomas positive | Sensitivity % | Nevi tested | Nevi negative | Specificity % |
|---|---|---|---|---|---|---|
123 | 102 | 83 | 110 | 103 | 94 | |
Ambiguous [85] | 12 | 6 | 50 | 6 | 4 | 66 |
Proof of principle [75] | 20 | 18 | 90 | 20 | 19 | 95 |
Lentiginous junctional melanoma of elderly [76] | 19 | 16 | 84 | 19 | 19 | 100 |
Melanoma and nevus [76] | 36 | 28 | 78 | 36 | 36 | 100 |
Blue nevus-like metastasis versus epithelioid blue nevus [78] | 10 | 9 | 90 | 10 | 10 | 100 |
Metastatic melanoma versus intranodal nevus [79] | 42 | 34 | 81 | 17 | 16 | 94 |
Superficial pagetoid melanocytosis [80] | 7 | 5 | 71 | 6 | 6 | 100 |
Nevoid melanoma versus nevus [81] | 10 | 10 | 100 | 10 | 10 | 100 |
Conjunctival melanoma versus nevus [82] | 6 | 6 | 100 | 4 | 4 | 100 |
Desmoplastic melanoma versus sclerosing nevi [83] | 15 | 7 | 47 | 15 | 15 |


